
Xu Wang, Yuhe Zhao, Yunhong Ding, Sanshui Xiao, Jianji Dong. Tunable optical delay line based on integrated grating-assisted contradirectional couplers[J]. Photonics Research, 2018, 6(9): 880
- Photonics Research
- Vol. 6, Issue 9, 880 (2018)
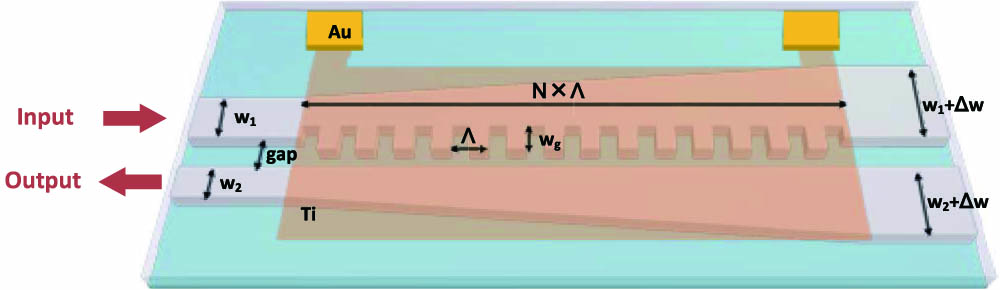
Fig. 1. Scheme of the proposed integrated grating-assisted contradirectional couplers.
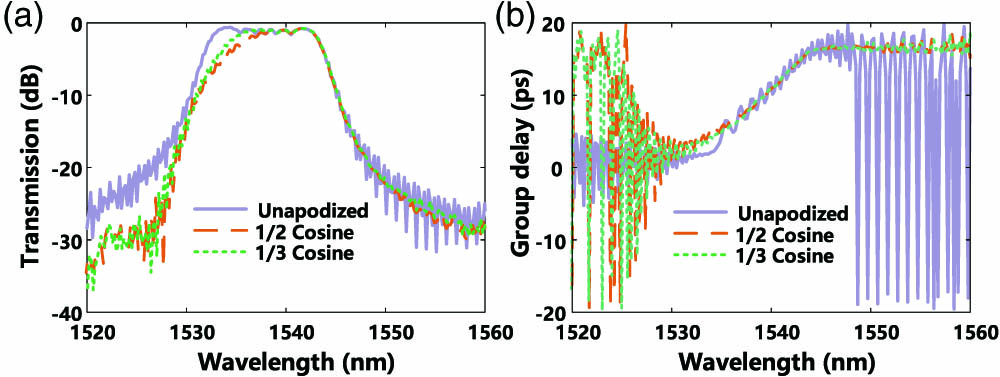
Fig. 2. (a) Simulated transmission spectra and (b) group-delay spectra for chirped Bragg gratings with different apodization filters applied. L = 710.4 μm w g = 50 nm w 1 = 570 nm w 2 = 470 nm Δ w = 20 nm gap = 180 nm
Fig. 3. (a) Measured transmission spectra of different grating periods with w 1 = 570 nm w 2 = 470 nm Δ w = 20 nm w 1 = 600 nm w 2 = 500 nm Δ w w 1 = 570 nm w 2 = 470 nm Λ = 296 nm w 1 = 570 nm w 2 = 470 nm Λ = 296 nm Δ w = 20 nm
Fig. 4. (a) Schematic of type I and type II heaters. (b) Spectral drift as a function of the applied voltage of the two types of heaters. Micrographs of (c) type I and (d) type II heaters.
Fig. 5. Experimental setup of the time-delay measurement. TLS, tunable laser source; PC, polarization controller; RF, radio frequency; IM, intensity modulator; EDFA, erbium-doped fiber amplifier; ATT, attenuator; OSC, oscilloscope.
Fig. 6. Measured spectral responses of (a) unapodized and (b) asymmetric apodized fabricated devices. Measured group delay lines of (c) unapodized and (d) asymmetric apodized fabricated devices.
Fig. 7. 10 GHz optical waveforms with different wavelengths after passing through the apodized device. Gray dot curves represent input waveforms; red curves represent delayed waveforms.
Fig. 8. (a) Schematic of a novel structure combining the grating-assisted contradirectional couplers with an ultra-compact reflector. (b) Measured spectral responses and (c) group delay lines of the fabricated device at different voltages. (d) Micrograph of the fabricated device.
Fig. 9. 5 GHz optical waveforms with different wavelengths after passing through the gratings with an ultra-compact reflector. Gray dot curves represent input waveforms; red curves represent delayed waveforms.

Set citation alerts for the article
Please enter your email address
© Copyright 2018-2021 | Chinese Laser Press. All Rights Reserved 沪ICP备15018463号-20