• Photonics Research
  • Vol. 10, Issue 1, 166 (2022)
Xi Xie1, Xianyou Wang1, Changjun Min1、2、*, Haixiang Ma1, Yunqi Yuan1, Zhangyu Zhou1, Yuquan Zhang1, Jing Bu1, and Xiaocong Yuan1、3、*
Author Affiliations
  • 1Nanophotonics Research Center, Shenzhen Key Laboratory of Micro-Scale Optical Information Technology, Shenzhen University, Shenzhen 518060, China
  • 2e-mail: cjmin@szu.edu.cn
  • 3e-mail: xcyuan@szu.edu.cn
  • show less
    DOI: 10.1364/PRJ.444341 Cite this Article Set citation alerts
    Xi Xie, Xianyou Wang, Changjun Min, Haixiang Ma, Yunqi Yuan, Zhangyu Zhou, Yuquan Zhang, Jing Bu, Xiaocong Yuan. Single-particle trapping and dynamic manipulation with holographic optical surface-wave tweezers[J]. Photonics Research, 2022, 10(1): 166 Copy Citation Text show less
    (a) Experimental setup of the holographic evanescent-wave tweezers system. Abbreviations: D, diaphragm; F, filter (532 nm); L, lens; P, polarizer; BS, beam splitter; RM, reflection mirror; SLM, spatial light modulator. (b) Schematic of single-particle trapping by using bifocal evanescent-wave tweezers. The central evanescent wave peak (red) can trap a single gold particle, while the donut-shaped evanescent wave (blue) repels all other particles outward. Two red/blue color beams have the same wavelength of 532 nm. (c) Schematic of the phase hologram design. The hologram contains 1080×1080 pixels. Two different annular holograms (Regions 1 and 2) are loaded on the SLM with different focusing phase combined with blazed grating phase. The focal point of the incident annular beam is above/below the glass–water interface under the phase modulation of the hologram in Region 1 (red)/Region 2 (blue), leading to inward (red)/outward (blue) propagation of excited evanescent wave at glass–water interface, respectively. The part of the beam lower than the total reflection angle is filtered and thus not coded on the hologram.
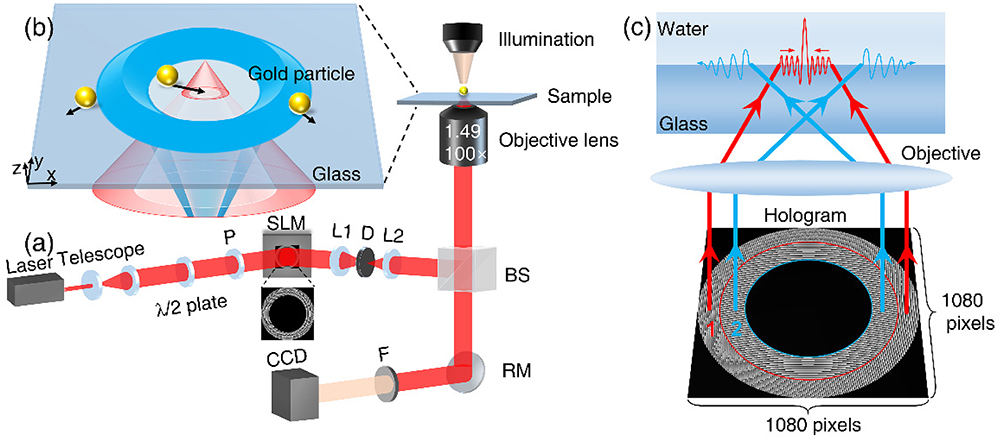
    Fig. 1. (a) Experimental setup of the holographic evanescent-wave tweezers system. Abbreviations: D, diaphragm; F, filter (532 nm); L, lens; P, polarizer; BS, beam splitter; RM, reflection mirror; SLM, spatial light modulator. (b) Schematic of single-particle trapping by using bifocal evanescent-wave tweezers. The central evanescent wave peak (red) can trap a single gold particle, while the donut-shaped evanescent wave (blue) repels all other particles outward. Two red/blue color beams have the same wavelength of 532 nm. (c) Schematic of the phase hologram design. The hologram contains 1080×1080 pixels. Two different annular holograms (Regions 1 and 2) are loaded on the SLM with different focusing phase combined with blazed grating phase. The focal point of the incident annular beam is above/below the glass–water interface under the phase modulation of the hologram in Region 1 (red)/Region 2 (blue), leading to inward (red)/outward (blue) propagation of excited evanescent wave at glass–water interface, respectively. The part of the beam lower than the total reflection angle is filtered and thus not coded on the hologram.
    (a) Normalized electric field distribution in the trapping plane (10 nm above the glass surface). (b)–(d) Normalized energy flow (Poynting vector) distribution under different incident energy ratios from Regions 1 and 2 in the trapping plane. Black arrows indicate the direction of energy flow at each point. The energy ratio of Region 1 to Region 2 is 1:2 in (b), 1:3 in (c), and 3:2 in (d). (e) The horizontal force (red curve) acting on a gold particle (diameter = 1 μm, 10 nm above the glass surface) and the potential well (blue curve) as a function of the distance of the particle from the center. The trap effect exists in the red region, and the repulsion effect exists in the blue region. Point A with zero force indicates the boundary between the two regions. The power of beam providing trap effect and repulsion effect is about 1.33 and 2.56 mW, respectively. (f) The lower figure shows the magnitude (background) and direction (black arrows) of the horizontal force acting on the gold particle at different positions in the XY plane. The upper figure shows the profile of the corresponding potential well distribution in the XY plane.
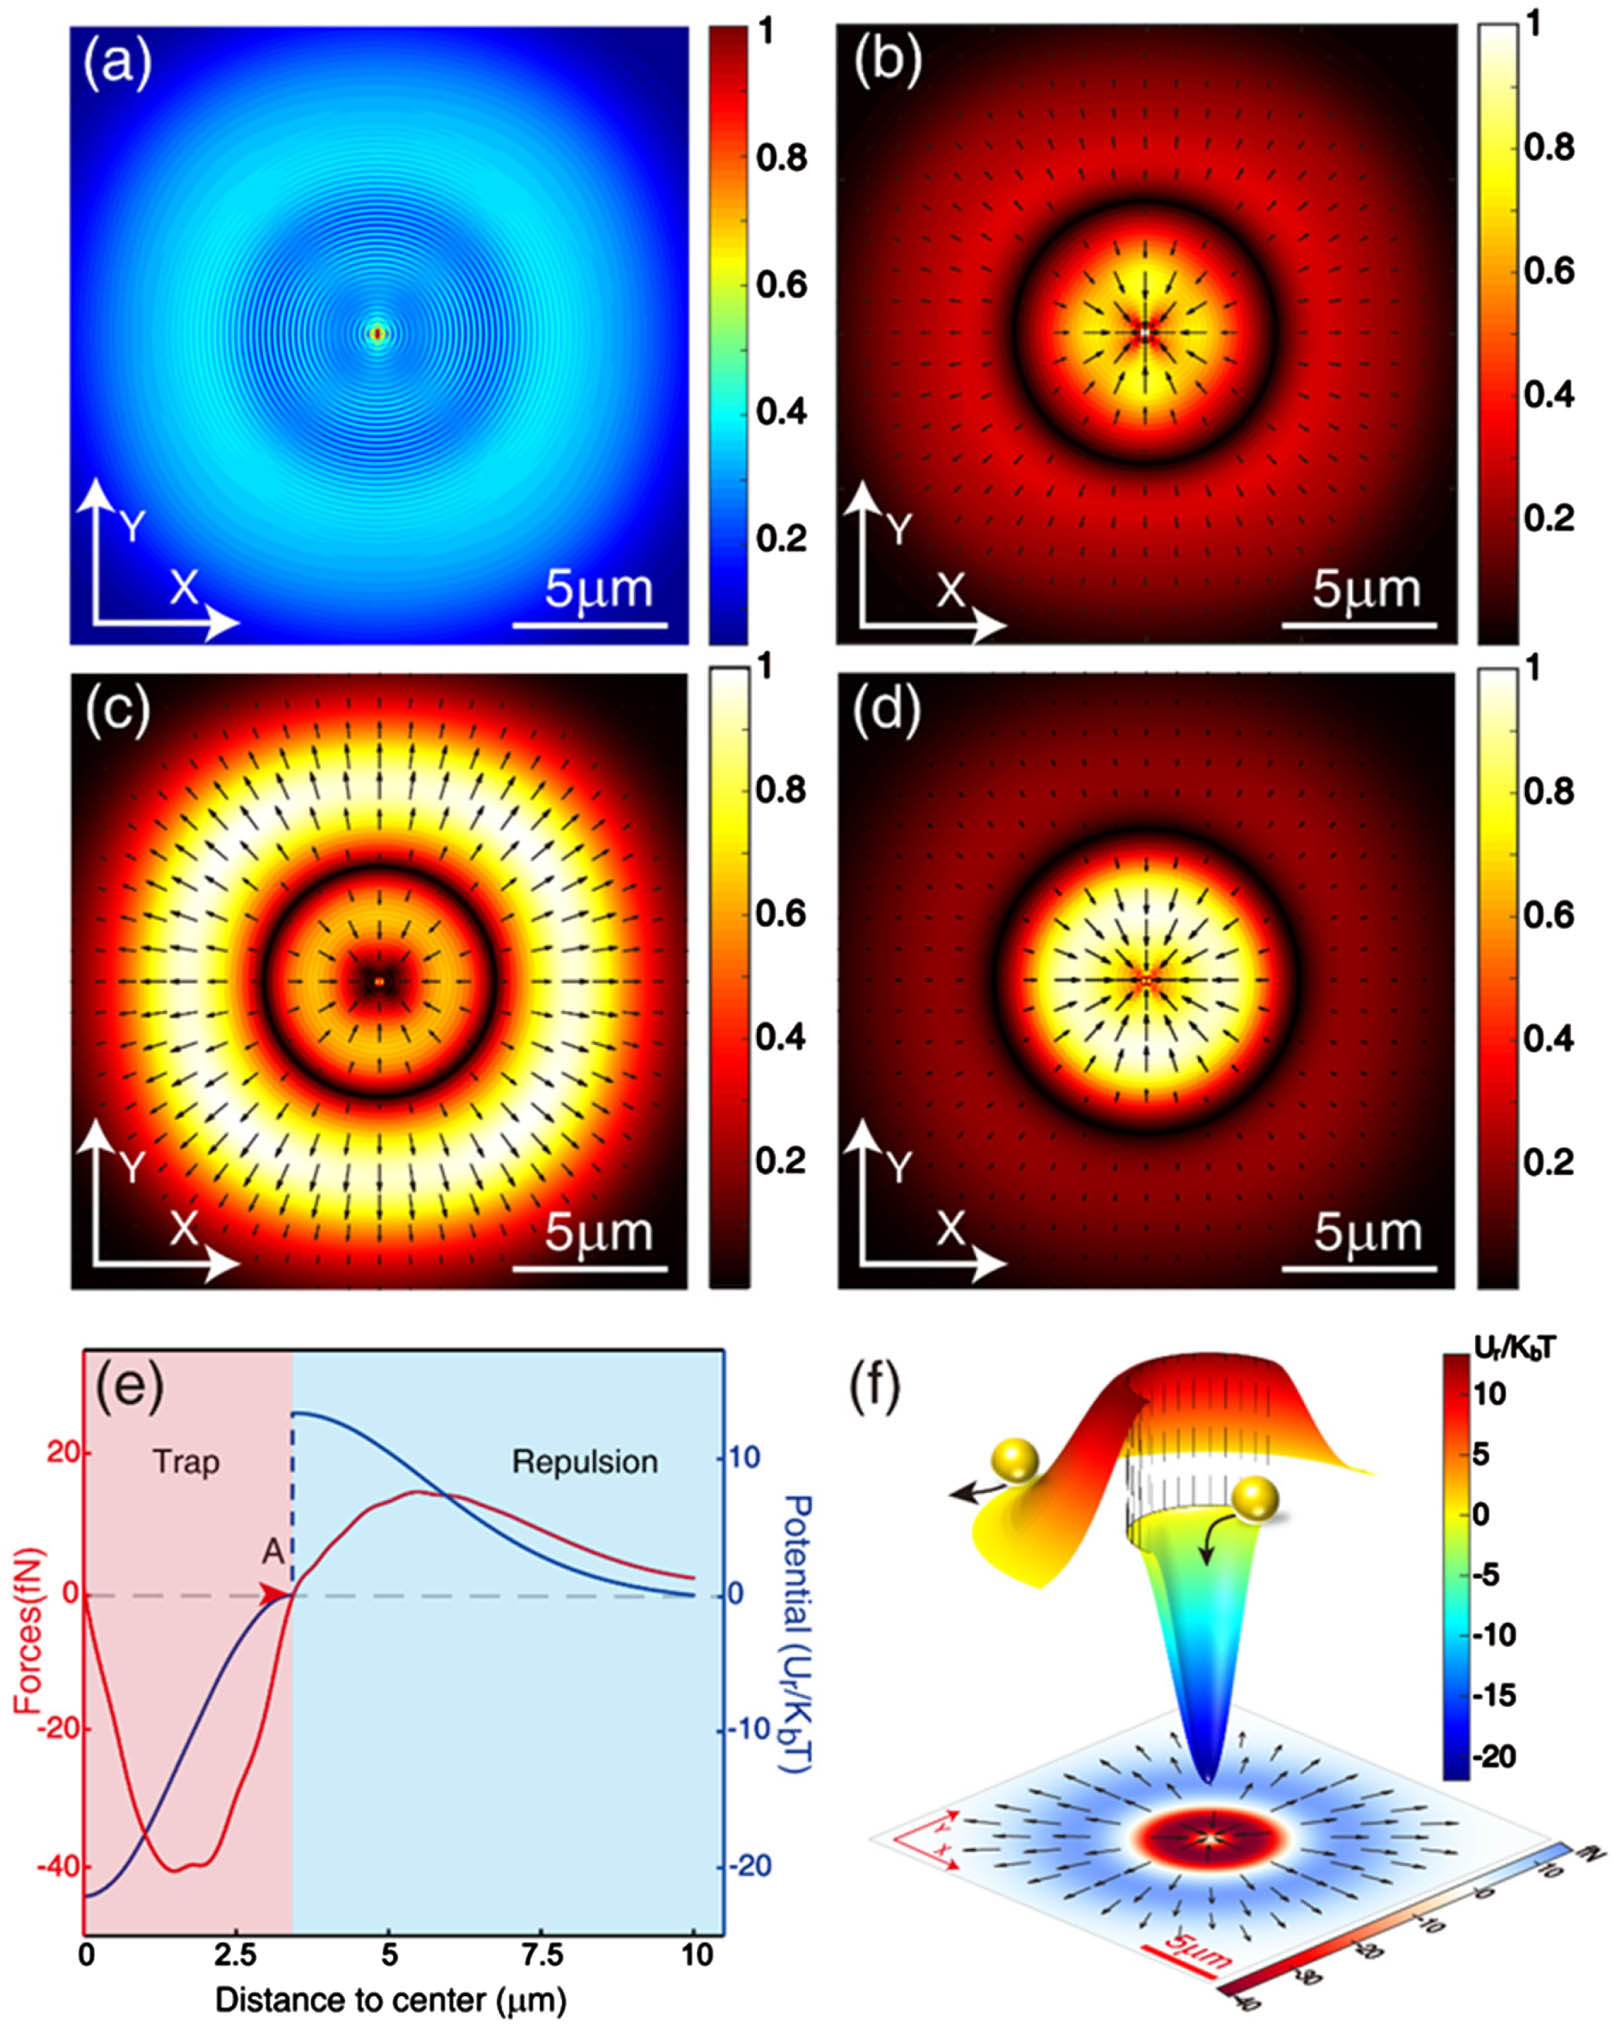
    Fig. 2. (a) Normalized electric field distribution in the trapping plane (10 nm above the glass surface). (b)–(d) Normalized energy flow (Poynting vector) distribution under different incident energy ratios from Regions 1 and 2 in the trapping plane. Black arrows indicate the direction of energy flow at each point. The energy ratio of Region 1 to Region 2 is 1:2 in (b), 1:3 in (c), and 3:2 in (d). (e) The horizontal force (red curve) acting on a gold particle (diameter = 1 μm, 10 nm above the glass surface) and the potential well (blue curve) as a function of the distance of the particle from the center. The trap effect exists in the red region, and the repulsion effect exists in the blue region. Point A with zero force indicates the boundary between the two regions. The power of beam providing trap effect and repulsion effect is about 1.33 and 2.56 mW, respectively. (f) The lower figure shows the magnitude (background) and direction (black arrows) of the horizontal force acting on the gold particle at different positions in the XY plane. The upper figure shows the profile of the corresponding potential well distribution in the XY plane.
    Experimental manipulation of gold particles (diameter: 0.8–1.5 μm) using the holographic evanescent-wave tweezers. (a1) The trajectory (colorful curves) of multiple particles in the evanescent wave field generated only by Hologram 1 [red in Fig. 1(c)], and the image at the beginning (a2) and end (a3) of the trajectory record. Yellow cross indicates the central optical axis, and the white arrows in (a2) show the movement direction of particles. (b1)–(b3) are similar to (a1)–(a3) but with the evanescent wave field generated only by Hologram 2 [blue in Fig. 1(c)]. The black dashed circle represents the boundary of the repulsive evanescent wave field. (c1)–(c3) are similar to (a1)–(a3) but with the evanescent wave field generated by both Hologram 1 and Hologram 2. The white arrow in (c2) indicates that the single particle trapped in the center was moved to the right side. The power of the incident beam (measured at the rear aperture position of the objective lens) in (a), (b), and (c) was 2.04, 1.8, and 3.84 mW, respectively. All white scale bars: 5 μm.
    Fig. 3. Experimental manipulation of gold particles (diameter: 0.8–1.5 μm) using the holographic evanescent-wave tweezers. (a1) The trajectory (colorful curves) of multiple particles in the evanescent wave field generated only by Hologram 1 [red in Fig. 1(c)], and the image at the beginning (a2) and end (a3) of the trajectory record. Yellow cross indicates the central optical axis, and the white arrows in (a2) show the movement direction of particles. (b1)–(b3) are similar to (a1)–(a3) but with the evanescent wave field generated only by Hologram 2 [blue in Fig. 1(c)]. The black dashed circle represents the boundary of the repulsive evanescent wave field. (c1)–(c3) are similar to (a1)–(a3) but with the evanescent wave field generated by both Hologram 1 and Hologram 2. The white arrow in (c2) indicates that the single particle trapped in the center was moved to the right side. The power of the incident beam (measured at the rear aperture position of the objective lens) in (a), (b), and (c) was 2.04, 1.8, and 3.84 mW, respectively. All white scale bars: 5 μm.
    (a) Lower figure shows the calculated magnitude (background) and direction (black arrows) of the horizontal force acting on a polystyrene bead at different positions in the XY plane. The upper figure shows the corresponding profile of potential well distribution of the polystyrene bead in the XY plane. The diameter of polystyrene bead is 1 μm; the refractive index is 1.5983. (b) Experimental video recordings of a single polystyrene bead trapped in the center and moved to the left simultaneously (white arrow at 0 s). Other polystyrene beads randomly moved toward the center but then were bounced off by the potential barrier (white dashed circle). Diameter of polystyrene bead: 1 μm. (c) Experimental video recordings of a single staphylococcus trapped in the center and moved to the left. Another staphylococcus randomly moved toward the center but then was bounced off by the potential barrier (white dashed circle), whose trajectory is given by the black dashed curve. Diameter of staphylococcus: 1 μm. The power of the incident beam in (b) and (c) was 7.5 and 3.3 mW, respectively. All scale bars: 5 μm.
    Fig. 4. (a) Lower figure shows the calculated magnitude (background) and direction (black arrows) of the horizontal force acting on a polystyrene bead at different positions in the XY plane. The upper figure shows the corresponding profile of potential well distribution of the polystyrene bead in the XY plane. The diameter of polystyrene bead is 1 μm; the refractive index is 1.5983. (b) Experimental video recordings of a single polystyrene bead trapped in the center and moved to the left simultaneously (white arrow at 0 s). Other polystyrene beads randomly moved toward the center but then were bounced off by the potential barrier (white dashed circle). Diameter of polystyrene bead: 1 μm. (c) Experimental video recordings of a single staphylococcus trapped in the center and moved to the left. Another staphylococcus randomly moved toward the center but then was bounced off by the potential barrier (white dashed circle), whose trajectory is given by the black dashed curve. Diameter of staphylococcus: 1 μm. The power of the incident beam in (b) and (c) was 7.5 and 3.3 mW, respectively. All scale bars: 5 μm.
    (a) Schematic (left) and experimental video recordings (right) of two trapped gold particles in the center rotated anticlockwise by the orbital angular momentum of incident beam and moved to the right (white arrow at 0 s) at the same time, while the surrounding particles were repelled by the potential barrier (white dashed circle) during the process. The black arrows indicate the motion direction of trapped particles. (b) Schematic (left) and experimental video recordings (right) of two trapped yeasts rotated anticlockwise by the orbital angular momentum of incident beam, while the surrounding yeast was repelled by the potential barrier (white dashed circle) during the process. The black arrows indicate the motion direction of trapped yeasts. The power of the incident beam in (a) and (b) was 3.75 and 23 mW, respectively. Diameter of yeast: 2.5–4 μm. All scale bars: 5 μm.
    Fig. 5. (a) Schematic (left) and experimental video recordings (right) of two trapped gold particles in the center rotated anticlockwise by the orbital angular momentum of incident beam and moved to the right (white arrow at 0 s) at the same time, while the surrounding particles were repelled by the potential barrier (white dashed circle) during the process. The black arrows indicate the motion direction of trapped particles. (b) Schematic (left) and experimental video recordings (right) of two trapped yeasts rotated anticlockwise by the orbital angular momentum of incident beam, while the surrounding yeast was repelled by the potential barrier (white dashed circle) during the process. The black arrows indicate the motion direction of trapped yeasts. The power of the incident beam in (a) and (b) was 3.75 and 23 mW, respectively. Diameter of yeast: 2.5–4 μm. All scale bars: 5 μm.
    Xi Xie, Xianyou Wang, Changjun Min, Haixiang Ma, Yunqi Yuan, Zhangyu Zhou, Yuquan Zhang, Jing Bu, Xiaocong Yuan. Single-particle trapping and dynamic manipulation with holographic optical surface-wave tweezers[J]. Photonics Research, 2022, 10(1): 166
    Download Citation