
Xi Xie, Xianyou Wang, Changjun Min, Haixiang Ma, Yunqi Yuan, Zhangyu Zhou, Yuquan Zhang, Jing Bu, Xiaocong Yuan, "Single-particle trapping and dynamic manipulation with holographic optical surface-wave tweezers," Photonics Res. 10, 166 (2022)
- Photonics Research
- Vol. 10, Issue 1, 166 (2022)
Abstract
1. INTRODUCTION
Through the momentum transfer between light and matter, micrometer-sized objects can be trapped and manipulated by optical tweezers [1–3]. Optical tweezers have advantages of noncontact manipulation and high biological safety at proper wavelength and therefore have been widely used in many fields, including microphysics, spectroscopy, nanotechnology, and cell biology [4–7]. Recently, researchers found that the accurate manipulation of a single tiny object, such as single molecule/cell/nanoparticle, is especially important in applications such as single-particle Raman spectroscopy, light absorption by a single particle, and quantum yield of a single nanoparticle [8], thus showing great significance in the fields of material science, molecular detection, biomedicine, and others. However, it is difficult for traditional optical tweezers to precisely trap and manipulate targeted single particles for two reasons. First, because the focal size in traditional optical tweezers cannot break through the diffraction limit of about
To break through the diffraction limit and generate a deep-subwavelength focal spot, optical tweezers based on surface waves, including evanescent wave [11–14], surface plasmon polariton (SPP) [15–23], and Bloch surface wave (BSW) [24], have been proposed for nanoscale particle trapping and manipulation. These optical surface waves can produce enhanced electromagnetic hotspots far beyond the diffraction limit, so that they are able to achieve a precise trap for not only traditional microscale samples but also for various nanoscale samples such as plasmonic nanoparticles, quantum dots, and DNA/RNA molecules [20–23], thus showing promising application in surface-enhanced Raman spectroscopy (SERS) [13,17,19], DNA/RNA characterization [22,23], on-chip protein detection [25], and others. Although an optical surface wave can generate deep-subwavelength hotspots and trap single particles with a low concentration in the environment, such single-particle trapping is not stable. For a long trap time, trapping of multiple particles around the hotspot rather than single particles still often happens due to other effects such as thermal convection [19–22] attracting the surrounding particles toward the hotspot. In order to avoid the influences of these effects and achieve single-particle trapping in surface-wave tweezers, in our previous work, several methods have been proposed and studied, such as dual-wavelength SPP tweezers [17] and metalens-based SPP tweezers [18]. In these optical tweezers, two types of surface plasmon fields are excited, one of which can trap a single particle, while the other can repel the surrounding particles, thus guaranteeing single-particle trapping for both micro- and nanoscale particles. Nevertheless, these methods have high requirements in experimental systems such as two laser sources with different wavelengths [17] or fabrication of metalens structures [18]; moreover, further dynamic manipulation of the trapped single particle is difficult in these systems.
Here, we propose a new method to achieve both accurate trap and dynamic manipulation of a single particle or a desired number of particles with a holographic optical surface-wave tweezers system. Through the design of phase holograms for incident light, we separate the focal field of the objective lens into two independent regions for tailoring the two excited surface-wave fields, one of which generates a negative potential well capable of trapping a single particle or a desired number of particles, and the other forms a positive potential barrier repelling all other particles around at the same time. Then, a reflective spatial light modulator (SLM) is used in our system to realize fast switching of the designed phase holograms, so as to dynamically control the generated potential well for the dynamic manipulation of the targeted single particle or particles. In this work, for simplicity, we take the evanescent-wave tweezers at the glass–water interface as an example for experimental verification, show the single-particle trapping and dynamic rotation of different samples such as metal/dielectric particles and biological cells, and prove that the experimental results agree with the theoretical studies of optical force and potential. This method can also be used for other surface-wave tweezers, including SPP and BSW tweezers, and has great significance in applications of Raman detection, cell sorting, nanoassembly, and so on.
Sign up for Photonics Research TOC. Get the latest issue of Photonics Research delivered right to you!Sign up now
2. METHODS AND SAMPLES
A. Experimental Setup and Method
Figure 1(a) shows the experimental setup of our optical tweezers system. A laser beam (MSL-FN-532-S, 400 mW, Changchun New Industries Optoelectronics Technology Co., Ltd.) with 532 nm wavelength first passes through a telescope system to fit the back aperture of the objective lens and is then modulated to linear polarization by using a
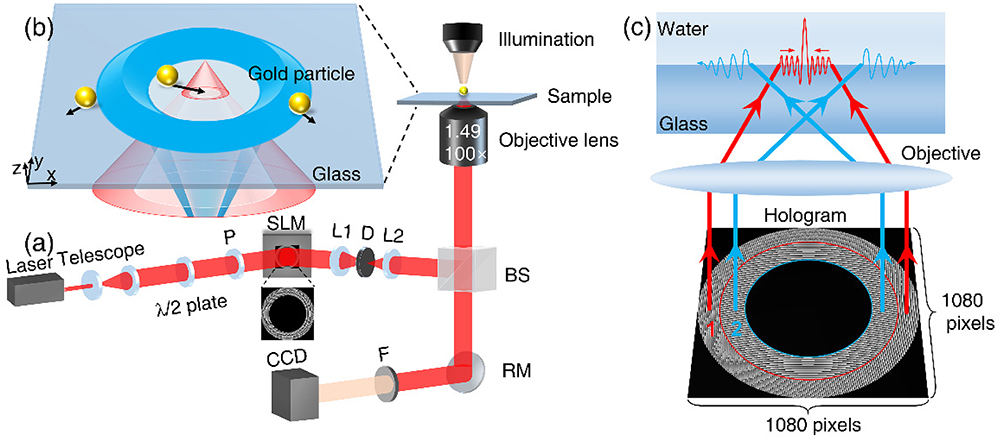
Figure 1.(a) Experimental setup of the holographic evanescent-wave tweezers system. Abbreviations: D, diaphragm; F, filter (532 nm); L, lens; P, polarizer; BS, beam splitter; RM, reflection mirror; SLM, spatial light modulator. (b) Schematic of single-particle trapping by using bifocal evanescent-wave tweezers. The central evanescent wave peak (red) can trap a single gold particle, while the donut-shaped evanescent wave (blue) repels all other particles outward. Two red/blue color beams have the same wavelength of 532 nm. (c) Schematic of the phase hologram design. The hologram contains 1080×1080 pixels. Two different annular holograms (Regions 1 and 2) are loaded on the SLM with different focusing phase combined with blazed grating phase. The focal point of the incident annular beam is above/below the glass–water interface under the phase modulation of the hologram in Region 1 (red)/Region 2 (blue), leading to inward (red)/outward (blue) propagation of excited evanescent wave at glass–water interface, respectively. The part of the beam lower than the total reflection angle is filtered and thus not coded on the hologram.
The schematic of single-particle trapping by the system is shown in Fig. 1(b), where a central evanescent-wave peak traps a single gold particle, and a donut-shaped evanescent field repels all other particles outward. To generate such dual evanescent fields, the principle of the phase hologram design is introduced in Fig. 1(c). It is well known that an evanescent wave is excited when the incident angle is larger than the total internal reflection angle (about 61.6° for the glass–water interface here). According to the aperture size of the oil objective (UAPON100× OTIRF,
Based on the TIR fluorescence (TIRF) oil objective with
In addition to the single particle trapping capability, our system can also trap a desired number of particles shielded from any other surrounding particles. When only Region 1 is loaded, the particles inside the generated evanescent field can be trapped in the center of the field one by one. Once the desired number of trapped particles is achieved, Region 2 will be loaded together with Region 1 to prevent interference from other particles. Thus, the number of trapped particles is controllable in our system. Moreover, the hologram of Region 1 can be combined with a spiral phase to rotate the trapped particles and even generate more complex dynamic operations for the trapped particle by other structured light [26]. At the same time, the hologram of Region 2 is kept so that the dynamic manipulation of the central trapped particle would not be influenced by the surrounding particles. The speed of image switching depends on the used SLM (60 Hz in our experiment). Besides SLM, a digital micromirror device can generate a complex optical field such as a perfect optical vortex [27]; it can also be used to switch the hologram in our system but with a much faster switching time (up to dozens of kHz).
B. Experimental Setup and Method
Samples and instruments used during sample preparation include gold particles (0.8–1.5 μm, Alfa Aesar Inc.), PS sphere (1 μm, BaseLine ChromTech Research Centre), yeast (Angel Yeast Co., Ltd.), staphylococcus (Shanghai Luwei Technology Co., Ltd.), pure water (Green Q3 Deionized Pure Water Machine, Nanjing Yipu Yida Technology Development Co., Ltd.), and ultrasonic cleaner (KQ5200DV, Kunshan Ultrasonic Instruments Co., Ltd.).
Sample preparation methods are as follows. Gold particles: use a pipette to suck a small amount of gold particles powder, add pure water to 5 mL, and then sonicate for 15 min. PS sphere: use a pipette to transfer 10 μL of PS sphere, add pure water to 5 mL, and then sonicate for 15 min. Staphylococcus: take about 10 μL of the strain, add pure water to 5 mL, stir well, and then sonicate for 15 min. Yeast: take about 0.3 mg of staphylococcus, add pure water to 5 mL, and then sonicate for 15 min.
3. RESULTS AND DISCUSSION
A. Theoretical Study of the Holographic Evanescent-Wave Tweezers
In order to theoretically verify the effect of holographic evanescent-wave tweezers produced by the two designed holograms in Fig. 1(c), we studied the electromagnetic field and Poynting vector distributions of the evanescent wave excited at the glass–water interface by using a 3D finite difference time domain (3D FDTD) method (Lumerical FDTD Solutions 2020 R2.4) and further calculated the optical force acting on a particle at different positions in such a dual evanescent-wave field with the Maxwell stress tensor method [28]. In FDTD simulation, the refractive indices of glass and water are 1.515 and 1.333, respectively, and the refractive index of gold particle is chosen from Ref. [29]. The two annular beams modulated by the phase holograms [Fig. 1(c)] are linearly polarized (along the
Figure 2(a) shows the electric field distribution at 10 nm above the glass–water interface (
![]()
Figure 2.(a) Normalized electric field distribution in the trapping plane (10 nm above the glass surface). (b)–(d) Normalized energy flow (Poynting vector) distribution under different incident energy ratios from Regions 1 and 2 in the trapping plane. Black arrows indicate the direction of energy flow at each point. The energy ratio of Region 1 to Region 2 is 1:2 in (b), 1:3 in (c), and 3:2 in (d). (e) The horizontal force (red curve) acting on a gold particle (diameter = 1 μm, 10 nm above the glass surface) and the potential well (blue curve) as a function of the distance of the particle from the center. The trap effect exists in the red region, and the repulsion effect exists in the blue region. Point A with zero force indicates the boundary between the two regions. The power of beam providing trap effect and repulsion effect is about 1.33 and 2.56 mW, respectively. (f) The lower figure shows the magnitude (background) and direction (black arrows) of the horizontal force acting on the gold particle at different positions in the
In Fig. 2(e), the red curve plots the calculated negative (attractive) and positive (repulsive) forces in the horizontal direction exerted on a gold particle located at different distance to the center. Point A indicates the position with zero force, which is the boundary between the trap effect and repulsion effect. In other words, particles in the red region of Fig. 2(e) are trapped in the center, and particles in the blue region of Fig. 2(e) are repulsed, agreeing with the energy flow distribution [Fig. 2(b)]. We further study the corresponding trapping potential formed by the optical force, which determines the stability of the optical trap and can be calculated as
To further visualize the effect of potential well and optical force, in Fig. 2(f) we show the 2D optical force distribution in the
B. Experimental Verification of the Holographic Evanescent-Wave Tweezers
To verify the above theoretical studies, we carried out the experiments [system as shown in Fig. 1(a)] and obtained the results as presented in Fig. 3. In experiments, the dynamic behaviors of gold particles in three different cases of evanescent fields were studied. In the first case [Figs. 3(a1)–3(a3)], only the annular beam modulated by Hologram 1 [red in Fig. 1(c)] is incident; the particle trajectory results show that all particles located in the evanescent wave field are attracted toward the center and finally trapped at the center, verifying the expected trap effect of the inward-propagating evanescent waves. Then, in the second case [Figs. 3(b1)–3(b3)], only the beam modulated by Hologram 2 [blue in Fig. 1(c)] is incident; the particles gathered in the central region are rapidly (about 3 s) repelled away from the center by the ring-shaped outward propagating evanescent waves, proving the expected repulsive effect. In this process, the particles located in the center will first be attracted to the vicinity of the excited annular evanescent-wave field by the optical gradient force; then, they will be repelled to the outside by the strong scattering force according to the energy flow (Poynting vector). Thus, all particles were immediately repelled out of the boundary of the potential barrier generated by Hologram 2 and prevented to enter from outside. When the focus of the beam from Region 2 is close to the glass–water interface, the repulsive potential barrier can reach the minimum size that is close to the focal spot of the excited evanescent wave. Since the evanescent wave can break through the diffraction limit and generate a subwavelength focal spot, in theory, the minimum size of the repulsive wall can also break through the diffraction limit.
![]()
Figure 3.Experimental manipulation of gold particles (diameter: 0.8–1.5 μm) using the holographic evanescent-wave tweezers. (a1) The trajectory (colorful curves) of multiple particles in the evanescent wave field generated only by Hologram 1 [red in Fig.
When the two effects are combined [Fig. 3(c)], we can achieve the single-particle trapping in the center and simultaneously exclude all the surrounding particles from the potential barrier (dashed circle) during the process (about 20 s) of moving the trapped single particle to the right. Figure 3(c1) presents the corresponding trajectory diagram of the process, which clearly shows that the trajectory of the trapped single particle is always near the central optical axis (yellow cross), but all the surrounding particles are blocked by the potential barrier (dashed circle region). The experimental videos of the above three cases are shown in the
Because the penetration depth of most optical surface waves is only a few hundred nanometers, our method is only suitable for trapping and manipulation of particles in a 2D plane; other particles in water may enter the trap from above. Although we cannot prevent a particle entering the trap from above, we can still push the particle away by modulating Region 2 of the hologram in the SLM just as shown in Figs. 3(b2) and 3(b3).
Although our method can be applied to both micro- and nanoscale particles, it is difficult to clearly observe nanoparticles in our experimental system; therefore, we chose the particles with 0.8–1.5 μm in diameter, whose size is larger and thermal motion is weaker, to clearly show the experimental results and also prove its application in biological cells in the micrometer range.
C. Single-Particle Trapping of Dielectric and Biological Samples
Besides metallic particles, the single-particle trapping effect can also be achieved for other samples such as dielectric particles and biological cells in our holographic evanescent-wave tweezers system. Figure 4(a) shows the theoretically calculated optical force and potential well distributions for a polystyrene bead in the
![]()
Figure 4.(a) Lower figure shows the calculated magnitude (background) and direction (black arrows) of the horizontal force acting on a polystyrene bead at different positions in the
For many biomedical researches, it is desirable that a single biological cell could be trapped [7,31]. Figure 4(c) shows the experimental process of a single staphylococcus trapped in our system and moved to the left simultaneously. It can be observed that, during the process, another outer staphylococcus randomly moved toward the center but then was bounced off by the repulsed potential barrier, proving the ability of our system in trapping single biological samples. The experimental videos of Fig. 4 are shown in the
In fact, when the concentration of particles is low (e.g., only one particle in the field of view), the traditional optical surface wave tweezers can indeed trap a single particle, but such single-particle trapping is not stable. In the case of a long trap time required for applications (such as drug experiments and observation of cell physiological activities), randomly moving particles could also be captured and thereby interfere with the experiment. In contrast, our proposed method can stably trap single particles or a desired number of particles undisturbed by surrounding particles, even with a high concentration of particles in the environment and a trap time as long as the laser continues to work.
D. Dynamic and Undisturbed Manipulation of Trapped Samples
Benefiting from the fast switching functionality of an SLM, we further developed a dynamic trapping and manipulation approach to the aforementioned system by loading various holograms onto an SLM. Figure 5(a) shows the time diagram of two trapped particles moving to the right, while a spiral phase (topological charge of 10) is added to Hologram 1 [Fig. 1(c)] to rotate the trapped particles by the orbital angular momentum of incident light beam [32]. It can be seen that the two trapped particles rotated in a counterclockwise direction, and the particles outside the trapping region were always repulsed during the process. To verify the dynamic and undisturbed manipulation of biological samples, in Fig. 5(b) we show the time diagram of two trapped yeasts rotating counterclockwise, with the topological charge of 20 to match the larger size of yeast. The experimental videos of Fig. 5 are shown in the
![]()
Figure 5.(a) Schematic (left) and experimental video recordings (right) of two trapped gold particles in the center rotated anticlockwise by the orbital angular momentum of incident beam and moved to the right (white arrow at 0 s) at the same time, while the surrounding particles were repelled by the potential barrier (white dashed circle) during the process. The black arrows indicate the motion direction of trapped particles. (b) Schematic (left) and experimental video recordings (right) of two trapped yeasts rotated anticlockwise by the orbital angular momentum of incident beam, while the surrounding yeast was repelled by the potential barrier (white dashed circle) during the process. The black arrows indicate the motion direction of trapped yeasts. The power of the incident beam in (a) and (b) was 3.75 and 23 mW, respectively. Diameter of yeast: 2.5–4 μm. All scale bars: 5 μm.
In this system, the direction, speed, and diameter of the particle rotation can be further modulated by changing the topological charge of the incident beam as in previous reports [26,32]. All these operations can be dynamically controlled by the SLM with designed holograms in advance. In addition, it is noted that the circular repulsive region (white dashed circle in Figs. 4 and 5) can be enlarged or reduced by changing Hologram 2 [Fig. 1(c)]. However, to obtain a larger repulsive region, higher power of the incident beam is required to produce enough repulsive force.
Besides the rotation of a trapped sample, many other types of manipulation can be implemented by switching different holograms in SLM of our holographic evanescent-wave tweezers system. Different structured lights can be generated in our system to achieve multipoint trapping [33] or move particles along a specific trajectory [34]. Dynamic control of trapped particles is important in various applications such as SERS detection [35], viscosity measurement [36], and tomographic imaging [37] based on optical tweezers. These results also demonstrate our method’s potential in many biological applications, such as monitoring the tumor cells’ apoptosis progression [38] and the drug resistance of lung cancer cells [39]. Our single-particle trapping method can also play an important role in single-cell Raman detection [40,41], which enables detecting rich and intrinsic information of the targeted cell and prohibits interference from other biological samples in a complicated environment. To distinguish the Raman signal of the trapped single cell from other cells, in addition to the laser beam for single-cell trapping, an additional incident beam with different wavelengths can be used to excite the Raman signal of the trapped single cell, as in our previous work [17].
4. CONCLUSION
In conclusion, we proposed a new method to achieve an accurate trap and dynamic manipulation of a single particle or a desired number of particles in a holographic optical surface-wave tweezers system. The specific method is to design different phase holograms for incident light, so as to control the surface wave excited by an objective lens and tailor the optical potential wells for particle manipulation. For single-particle trapping, a deep potential well is generated by focusing surface waves to trap a single particle, while another potential barrier is formed to repel the surrounding particles. For dynamic manipulation of trapped particles, the fast switching of holograms on an SLM is used to dynamically control the optical force and potential well, so as to achieve dynamic manipulation such as rotation of particles. It is also proved that this system is effective for biological samples such as staphylococcus and yeast. All experimental results agree with the theoretical predictions.
Although here we use microparticles for clear observation, it should be noted that our method can also be applied to trap nanoparticles. Many previous works have proved nanoparticle trapping by using optical surface waves, for example, manipulating gold nanoparticles to move along a waveguide using evanescent waves [42,43], as well as dynamic manipulation of nanoparticles using SPP [44]. In our previous work of single-particle trapping, the particles with a radius of 100 nm were also used [17]. When our method is applied to nanoparticles, the main problem is that the Brownian motion of small particles is more intense. To limit the movement of the trapped central particles, it is necessary to accurately modulate the range and intensity of the central light field and make the central trapping potential well as small and deep as possible. In addition, we can also consider adding a thermoelectric effect [45] to further reduce the heat-induced Brownian motion of particles and improve the trapping stability.
In addition to evanescent waves, it should be noted that this method can also be used for other optical surface waves such as SPP [15] and BSW [24]. For the excitation of SPP and BSW, the incident angle should be precisely tuned to the resonant angle, and the incident polarization state should be modulated to radial and angular polarization, respectively. These excitation requirements can be achieved by converting the incident beam into a perfect radially/azimuthally polarized beam, as shown in our previous works [24,46]. It has great significance in many applications, including single-particle spectroscopy, cell sorting, nano-assembly and so on. Besides controlling the optical force and potential well, this method has the potential to regulate the light-induced thermal field in solution and thus be applied in opto-thermoelectric nanotweezers, thermophoresis technique, and so on [45,47,48].
References
[1] A. Ashkin. Acceleration and trapping of particles by radiation pressure. Phys. Rev. Lett., 24, 156-159(1970).
[2] J. R. Moffitt, Y. R. Chemla, S. B. Smith, C. Bustamante. Recent advances in optical tweezers. Annu. Rev. Biochem., 77, 205-228(2008).
[3] W. Ding, T. Zhu, L. Zhou, C. Qiu. Photonic tractor beams: a review. Adv. Photon., 1, 024001(2019).
[4] T. Li, S. Kheifets, M. G. Raizen. Millikelvin cooling of an optically trapped microsphere in vacuum. Nat. Phys., 7, 527-530(2011).
[5] D. V. Petrov. Raman spectroscopy of optically trapped particles. J. Opt. A, 9, S139-S156(2007).
[6] O. Romero-Isart, A. C. Pflanzer, F. Blaser, R. Kaltenbaek, N. Kiesel, M. Aspelmeyer, J. I. Cirac. Large quantum superpositions and interference of massive nanometer-sized objects. Phys. Rev. Lett., 107, 020405(2011).
[7] A. D. Mehta, M. Rief, J. A. Spudich, D. A. Smith, R. M. Simmons. Single-molecule biomechanics with optical methods. Science, 283, 1689-1695(1999).
[8] J. Zhou, A. I. Chizhik, S. Chu, D. Jin. Single-particle spectroscopy for functional nanomaterials. Nature, 579, 41-50(2020).
[9] S. Stoll, J. Delon, T. M. Brotz, R. N. Germain. Dynamic imaging of T cell-dendritic cell interactions in lymph nodes. Science, 296, 1873-1876(2002).
[10] Q. Zhao, H. W. Wang, P. P. Yu, S. H. Zhang, J. H. Zhou, Y. M. Li, L. Gong. Trapping and manipulation of single cells in crowded environments. Front. Bioeng. Biotechnol., 8, 422(2020).
[11] S. Kawata, T. Sugiura. Movement of micrometer-sized particles in the evanescent field of a laser beam. Opt. Lett., 17, 772-774(1992).
[12] D. Ganic, X. Gan, M. Gu. Trapping force and optical lifting under focused evanescent wave illumination. Opt. Express, 12, 5533-5538(2004).
[13] L. Kong, C. Lee, C. M. Earhart, B. Cordovez, J. W. Chan. A nanotweezer system for evanescent wave excited surface enhanced Raman spectroscopy (SERS) of single nanoparticles. Opt. Express, 23, 6793-6802(2015).
[14] Y. F. Xiang, X. Tang, C. J. Min, G. H. Rui, Y. Kuai, F. Y. Lu, P. Wang, H. Ming, Q. W. Zhan, X. C. Yuan, J. R. Lakowicz, D. G. Zhang. Optical trapping with focused surface waves. Ann. Phys., 532, 1900497(2020).
[15] Y. Zhang, C. Min, X. Dou, X. Wang, H. P. Urbach, M. G. Somekh, X. Yuan. Plasmonic tweezers: for nanoscale optical trapping and beyond. Light Sci. Appl., 10, 59(2021).
[16] C. Min, Z. Shen, J. Shen, Y. Zhang, H. Fang, G. Yuan, L. Du, S. Zhu, T. Lei, X. Yuan. Focused plasmonic trapping of metallic particles. Nat. Commun., 4, 2891(2013).
[17] Y. Zhang, J. Shen, Z. Xie, X. Dou, C. Min, T. Lei, J. Liu, S. Zhu, X. Yuan. Dynamic plasmonic nano-traps for single molecule surface-enhanced Raman scattering. Nanoscale, 9, 10694-10700(2017).
[18] X. Wang, Y. Dai, Y. Zhang, C. Min, X. Yuan. Plasmonic manipulation of targeted metallic particles by polarization-sensitive metalens. ACS Photon., 5, 2945-2950(2018).
[19] P. P. Patra, R. Chikkaraddy, R. P. N. Tripathi, A. Dasgupta, G. V. Pavan Kumar. Plasmofluidic single-molecule surface enhanced Raman scattering from dynamic assembly of plasmonic nanoparticles. Nat. Commun., 5, 4357(2014).
[20] C. Zhan, G. Wang, J. Yi, J. Wei, Z. Li, Z. Chen, J. Shi, Y. Yang, W. Hong, Z. Tian. Single-molecule plasmonic optical trapping. Matter, 3, 1350-1360(2020).
[21] S. J. Yoon, J. Lee, S. Han, C. K. Kim, C. W. Ahn, M. K. Kim, Y. H. Lee. Non-fluorescent nanoscopic monitoring of a single trapped nanoparticle via nonlinear point sources. Nat. Commun., 9, 2218(2018).
[22] M. Belkin, S. H. Chao, M. P. Jonsson, C. Dekker, A. Aksimentiev. Plasmonic nanopores for trapping, controlling displacement, and sequencing of DNA. ACS Nano, 9, 10598-10611(2015).
[23] D. V. Verschueren, S. Pud, X. Shi, L. De Angelis, L. Kuipers, C. Dekker. Label-free optical detection of DNA translocations through plasmonic nanopores. ACS Nano, 13, 61-70(2019).
[24] Y. Xiang, X. Tang, Y. Fu, F. Lu, Y. Kuai, C. Min, J. Chen, P. Wang, J. R. Lakowicz, X. Yuan, D. Zhang. Trapping metallic particles using focused Bloch surface waves. Nanoscale, 12, 1688-1696(2020).
[25] S. Lin, K. B. Crozier. Trapping-assisted sensing of particles and proteins using on-chip optical microcavities. ACS Nano, 7, 1725-1730(2013).
[26] Y. Yang, Y. Ren, M. Chen, Y. Arita, C. Rosales-Guzmán. Optical trapping with structured light: a review. Adv. Photon., 3, 034001(2021).
[27] C. Zhang, C. Min, X. C. Yuan. Shaping perfect optical vortex with amplitude modulated using a digital micro-mirror device. Opt. Commun., 381, 292-295(2016).
[28] D. J. Griffiths. Introduction to Electrodynamics, 351-356(1998).
[29] R. W. Christy. Optical constants of the noble metals. Phys. Rev. B, 6, 4379(1972).
[30] L. Novotny, R. X. Bian, X. S. Xie. Theory of nanometric optical tweezers. Phys. Rev. Lett., 79, 645-648(1997).
[31] H. Zhang, K. K. Liu. Optical tweezers for single cells. J. R. Soc. Interface, 5, 671-690(2008).
[32] Z. Shen, Z. J. Hu, G. H. Yuan, C. J. Min, H. Fang, X.-C. Yuan. Visualizing orbital angular momentum of plasmonic vortices. Opt. Lett., 37, 4627-4629(2012).
[33] M. P. MacDonald, L. Paterson, K. Volke-Sepulveda, J. Arlt, W. Sibbett, K. Dholakia. Creation and manipulation of three-dimensional optically trapped structures. Science, 296, 1101-1103(2002).
[34] J. E. Curtis, D. G. Grier. Modulated optical vortices. Opt. Lett., 28, 872-874(2003).
[35] Y. Yu, T. Xiao, Y. Wu, W. Li, Q. Zeng, L. Long, Z. Li. Roadmap for single-molecule surface-enhanced Raman spectroscopy. Adv. Photon., 2, 014002(2020).
[36] L. S. Madsen, M. Waleed, C. A. Casacio, A. Terrasson, A. B. Stilgoe, M. A. Taylor, W. P. Bowen. Ultrafast viscosity measurement with ballistic optical tweezers. Nat. Photonics, 15, 386-392(2021).
[37] M. Lee, K. Kim, J. Oh, Y. Park. Isotropically resolved label-free tomographic imaging based on tomographic moulds for optical trapping. Light Sci. Appl., 10, 102(2021).
[38] Y. Zhang, X. Wu, C. Min, S. Zhu, H. P. Urbach, X. Yuan. Engineered tumor cell apoptosis monitoring method based on dynamic laser tweezers. BioMed. Res. Int., 2014, 279408(2014).
[39] X. Wu, Y. Zhang, C. Min, S. Zhu, J. Feng, X. C. Yuan. Dynamic optical tweezers based assay for monitoring early drug resistance. Laser Phys. Lett., 10, 065604(2013).
[40] H. Wu, J. V. Volponi, A. E. Oliver, A. N. Parikh, B. A. Simmons, S. Singh.
[41] M. Li, J. Xu, M. Romero-Gonzalez, S. A. Banwart, W. E. Huang. Single cell Raman spectroscopy for cell sorting and imaging. Curr. Opin. Biotechnol., 23, 56-63(2012).
[42] L. N. Ng, M. N. Zervas, J. S. Wilkinson, B. J. Luff. Manipulation of colloidal gold nanoparticles in the evanescent field of a channel waveguide. Appl. Phys. Lett., 76, 1993-1995(2000).
[43] J. P. Hole, J. S. Wilkinson, K. Grujic, O. G. Hellesø. Velocity distribution of gold nanoparticles trapped on an optical waveguide. Opt. Express, 13, 3896-3901(2005).
[44] P. R. Huft, J. D. Kolbow, J. T. Thweatt, N. C. Lindquist. Holographic plasmonic nanotweezers for dynamic trapping and manipulation. Nano Lett., 17, 7920-7925(2017).
[45] L. Lin, M. Wang, X. Peng, E. N. Lissek, Z. Mao, L. Scarabelli, E. Adkins, S. Coskun, H. E. Unalan, B. A. Korgel, L. M. Liz-Marzan, E. L. Florin, Y. Zheng. Opto-thermoelectric nanotweezers. Nat. Photonics, 12, 195-201(2018).
[46] X. Wang, Y. Zhang, Y. Dai, C. Min, X. Yuan. Enhancing plasmonic trapping with a perfect radially polarized beam. Photon. Res., 6, 847-852(2018).
[47] B. Ciraulo, J. Garcia-Guirado, I. de Miguel, J. O. Arroyo, R. Quidant. Long-range optofluidic control with plasmon heating. Nat. Commun., 12, 2001(2021).
[48] Q. Jiang, B. Rogez, J. B. Claude, G. Baffou, J. Wenger. Quantifying the role of the surfactant and the thermophoretic force in plasmonic nano-optical trapping. Nano Lett., 20, 8811-8817(2020).


Set citation alerts for the article
Please enter your email address

© Copyright 2018-2021 | Chinese Laser Press. All Rights Reserved 沪ICP备15018463号-20