- Spectroscopy and Spectral Analysis
- Vol. 42, Issue 7, 2039 (2022)
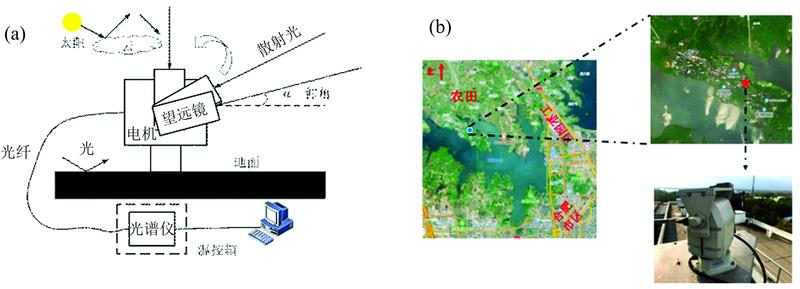
Fig. 1. (a) Experimental setup of MAX-DOAS, (b) MAX-DOAS instrument and Observation site
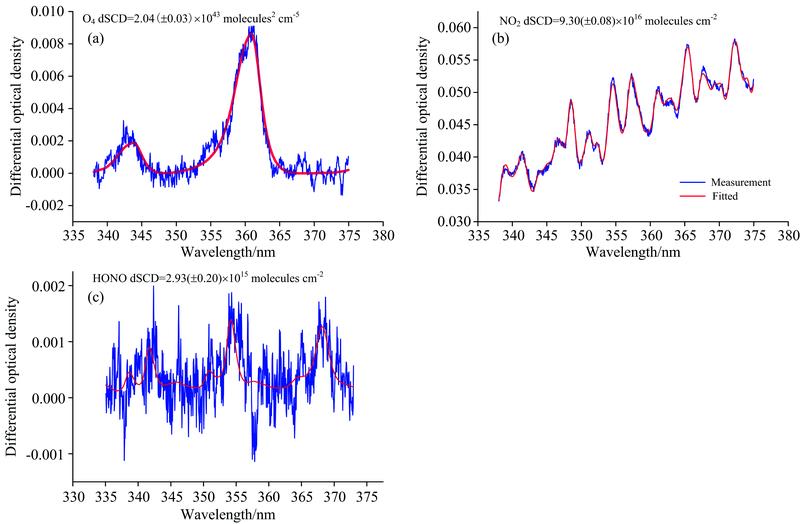
Fig. 2. Example of deconvolution of the DOAS spectrum in evaluation (a) O4, (b) NO2 and (c) HONO slant column densities of 2°elevation spectrum at 9:00 (Local Time) in December 9, 2017
Bule lines represent the absorption signal and red lines represent the fit signal
Bule lines represent the absorption signal and red lines represent the fit signal
Fig. 3. A totally average daveraging kernel of (a) aerosol, (b) NO2 and (c) HONO at 09:00 (Local Time) on December 8, 2017
The thin line represents the average nucleus connection curve, and the different colors represent different selected height layers (both 200 m are taken as one layer). The thick bmack solid line represents the envelope obtained by the inversion
The thin line represents the average nucleus connection curve, and the different colors represent different selected height layers (both 200 m are taken as one layer). The thick bmack solid line represents the envelope obtained by the inversion
Fig. 4. The near-surface concentration (a) and vertical columndensity(b) of NO2 and HONO the first line of each figure is the profile of NO2 and HONO. The second line shows the time series for the ratio of HONO to NO2; And the third line is the time series of the AQI data released by the National Control Site named Dongpu Reservoir
The red dashed box indicates the deletion of MAX-DOAS observation data due to rainy, and the red dashed oval box indicates the lack of data due to instrumental observations
The red dashed box indicates the deletion of MAX-DOAS observation data due to rainy, and the red dashed oval box indicates the lack of data due to instrumental observations
Fig. 5. Time series of HONO (a) and NO2 (b) VMRs in the height of 10, 50 and 100 m
Fig. 6. (a) Temporal series profiles of NO2 and HONO VMRs for the period December 26—31, 2017; (b) The backward trajectories of winds from December 29 to December 31, 2017, simulated by the Hysplit model; (c) Wind rose during the entire pollution period
| |||||||||||||||||||||||||||||||||||||||||||||||||||||||||
Table 1. Parameter settings used for spectral analysis using the Windoas for NO2, O4, HCHO and HONO
|
Table 2. Detection limits of VCD and VMR of NO2 and HONO inversion by MAX-DOAS

Download Citation

Set citation alerts for the article
Please enter your email address
© Copyright 2018-2021 | Chinese Laser Press. All Rights Reserved 沪ICP备15018463号-20