
Yun-you HU, Liang XU, Han-yang XU, Xian-chun SHEN, Yong-feng SUN, Huan-yao XU, Ya-song DENG, Jian-guo LIU, Wen-qing LIU. Adaptive Matched Filter Detection for Leakage Gas Based on Multi-Frame Background[J]. Spectroscopy and Spectral Analysis, 2022, 42(10): 3307
- Spectroscopy and Spectral Analysis
- Vol. 42, Issue 10, 3307 (2022)
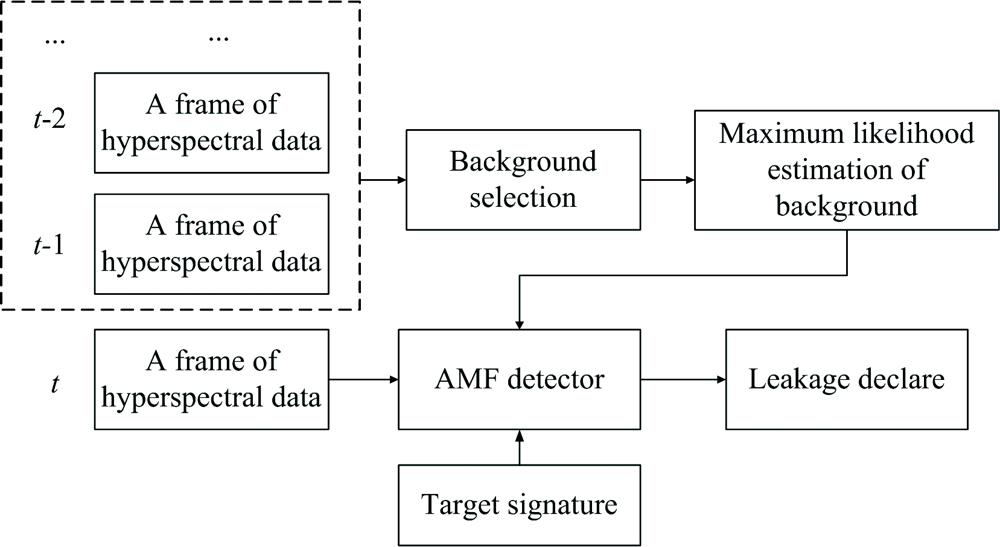
Fig. 1. Schematic diagram of leaking gas AMF detection based on multi-frame background
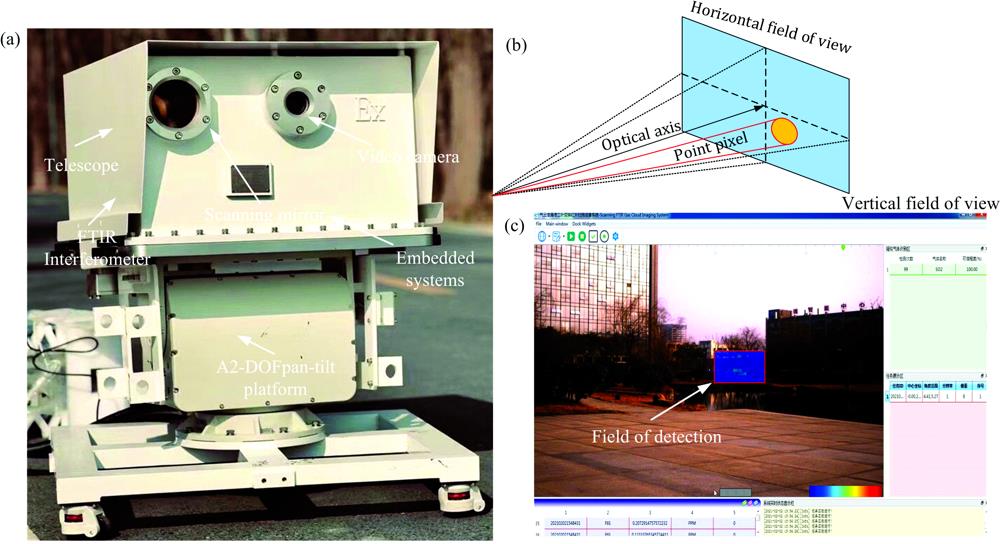
Fig. 2. Passive FTIR scanning remote sensing imaging system
(a): Experimental setup; (b): Schematic diagram of 2D scanning; (c): Remote sensing imaging software for unorganized leakage
(a): Experimental setup; (b): Schematic diagram of 2D scanning; (c): Remote sensing imaging software for unorganized leakage
Fig. 3. Measured SF6 transmittance spectrum
Fig. 4. Measured SF6 column concentration image
Fig. 5. (a) The measured spectrum, the background spectrum and the residual spectrum; (b) The ratio of the sliding standard deviation spectrum of the difference spectrum to its mean value
Fig. 6. (a) Comparison of AMF detection value and column concentration; (b) Comparison of ACE detection value and column concentration; (c) Comparison of ASD detection value and column concentration; (d) Comparison of OGLRT detection value and column concentration
Fig. 7. False color image with AMF detection information
Fig. 8. (a) ROC curve of four detection methods; (b) the ROC curve of AMF detection with different number of target spectra added to the background space
|
Table 1. The correlation between the column concentration curve and the detection value curve in Figure 6

Set citation alerts for the article
Please enter your email address
© Copyright 2018-2021 | Chinese Laser Press. All Rights Reserved 沪ICP备15018463号-20