
Zhi Song, Chang Lu, Guojun Wei, Yishen Xu, Yan Ye, Linsen Chen. Reflective Metasurface Filter with Optical Variable Color[J]. Acta Optica Sinica, 2021, 41(20): 2023001
- Acta Optica Sinica
- Vol. 41, Issue 20, 2023001 (2021)
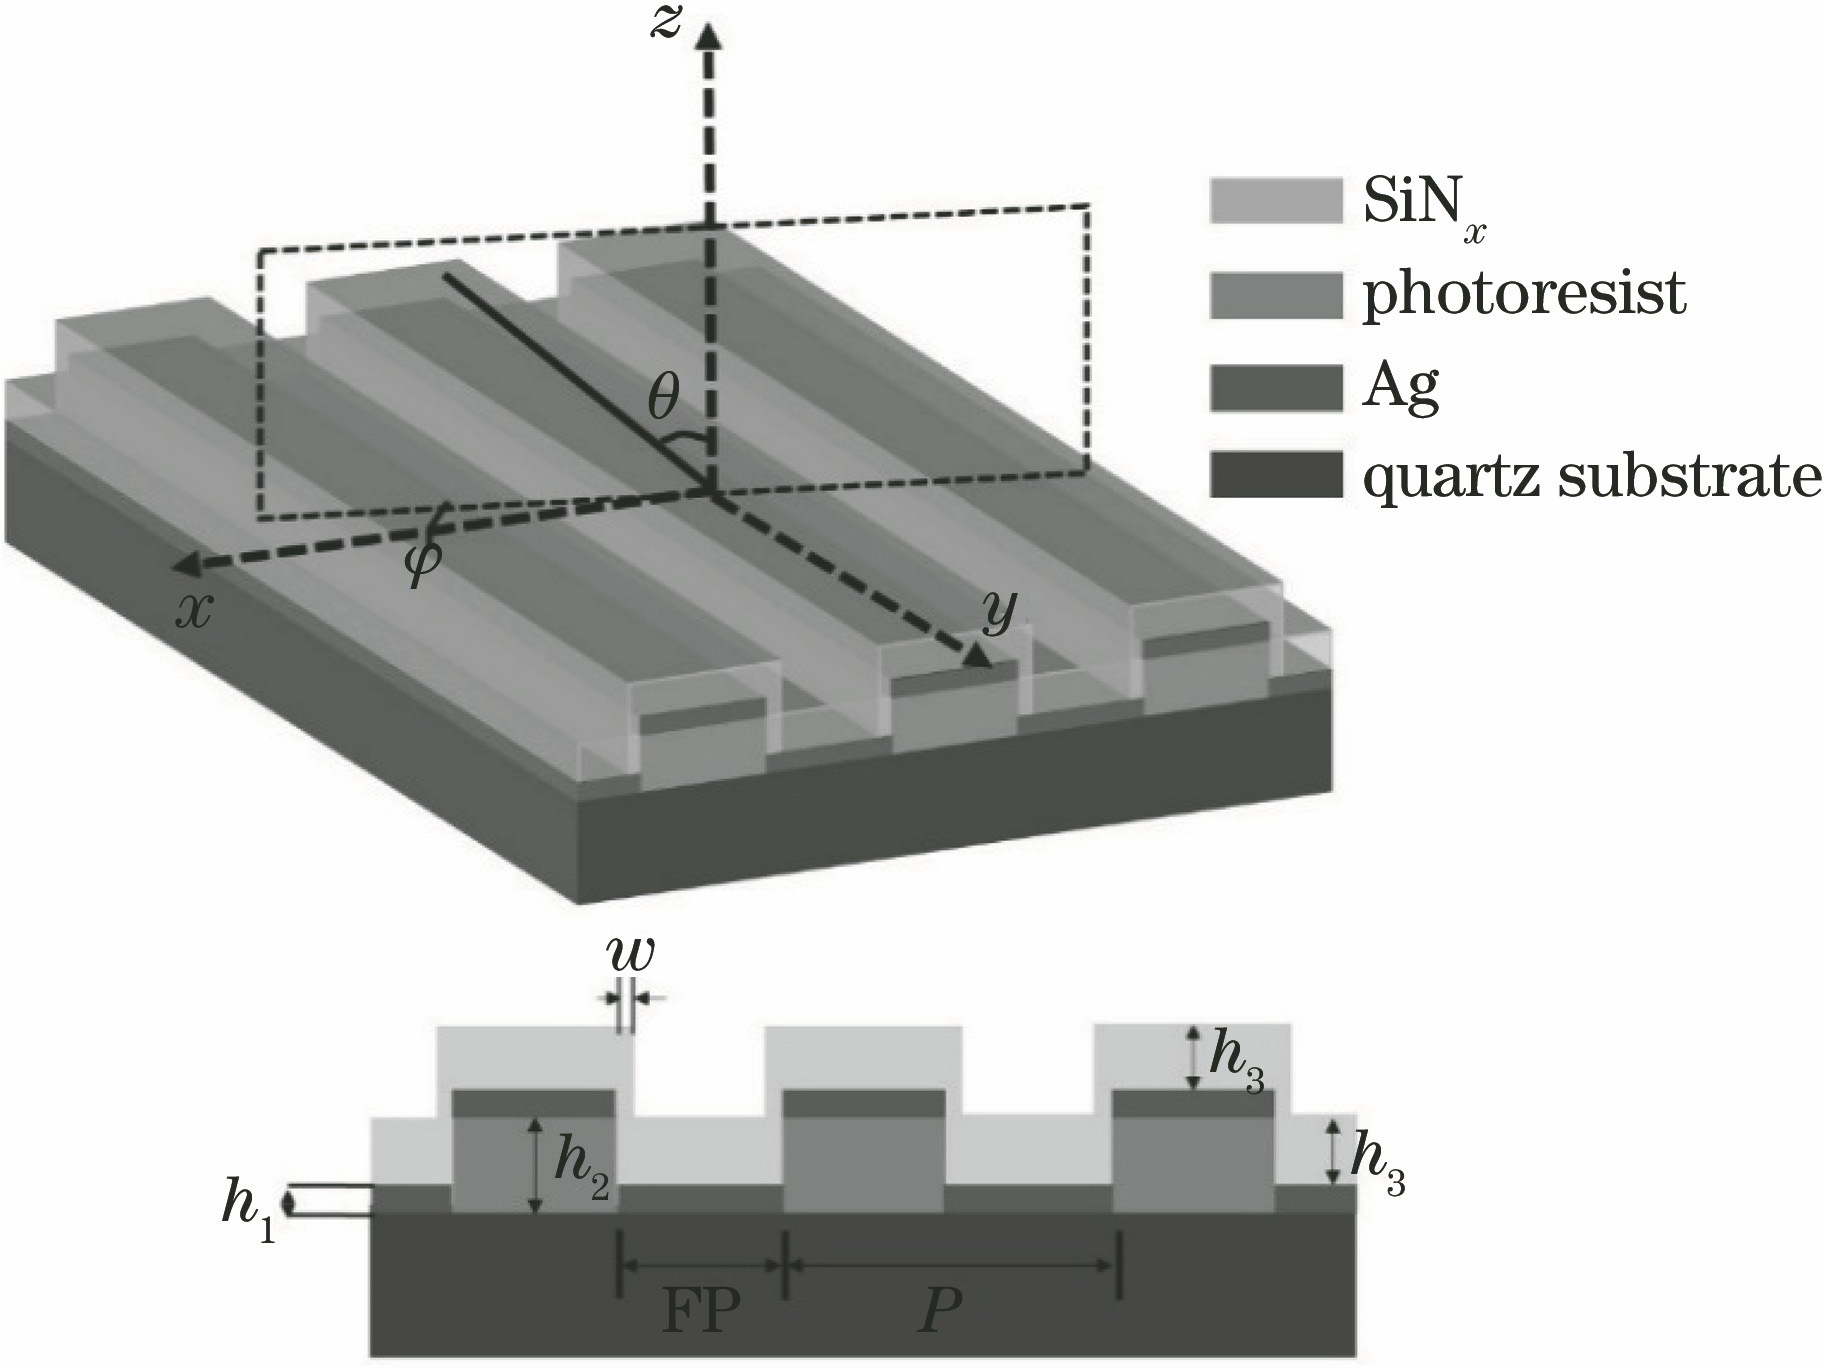
Fig. 1. Schematic diagram of metasurfacecolor filter structure
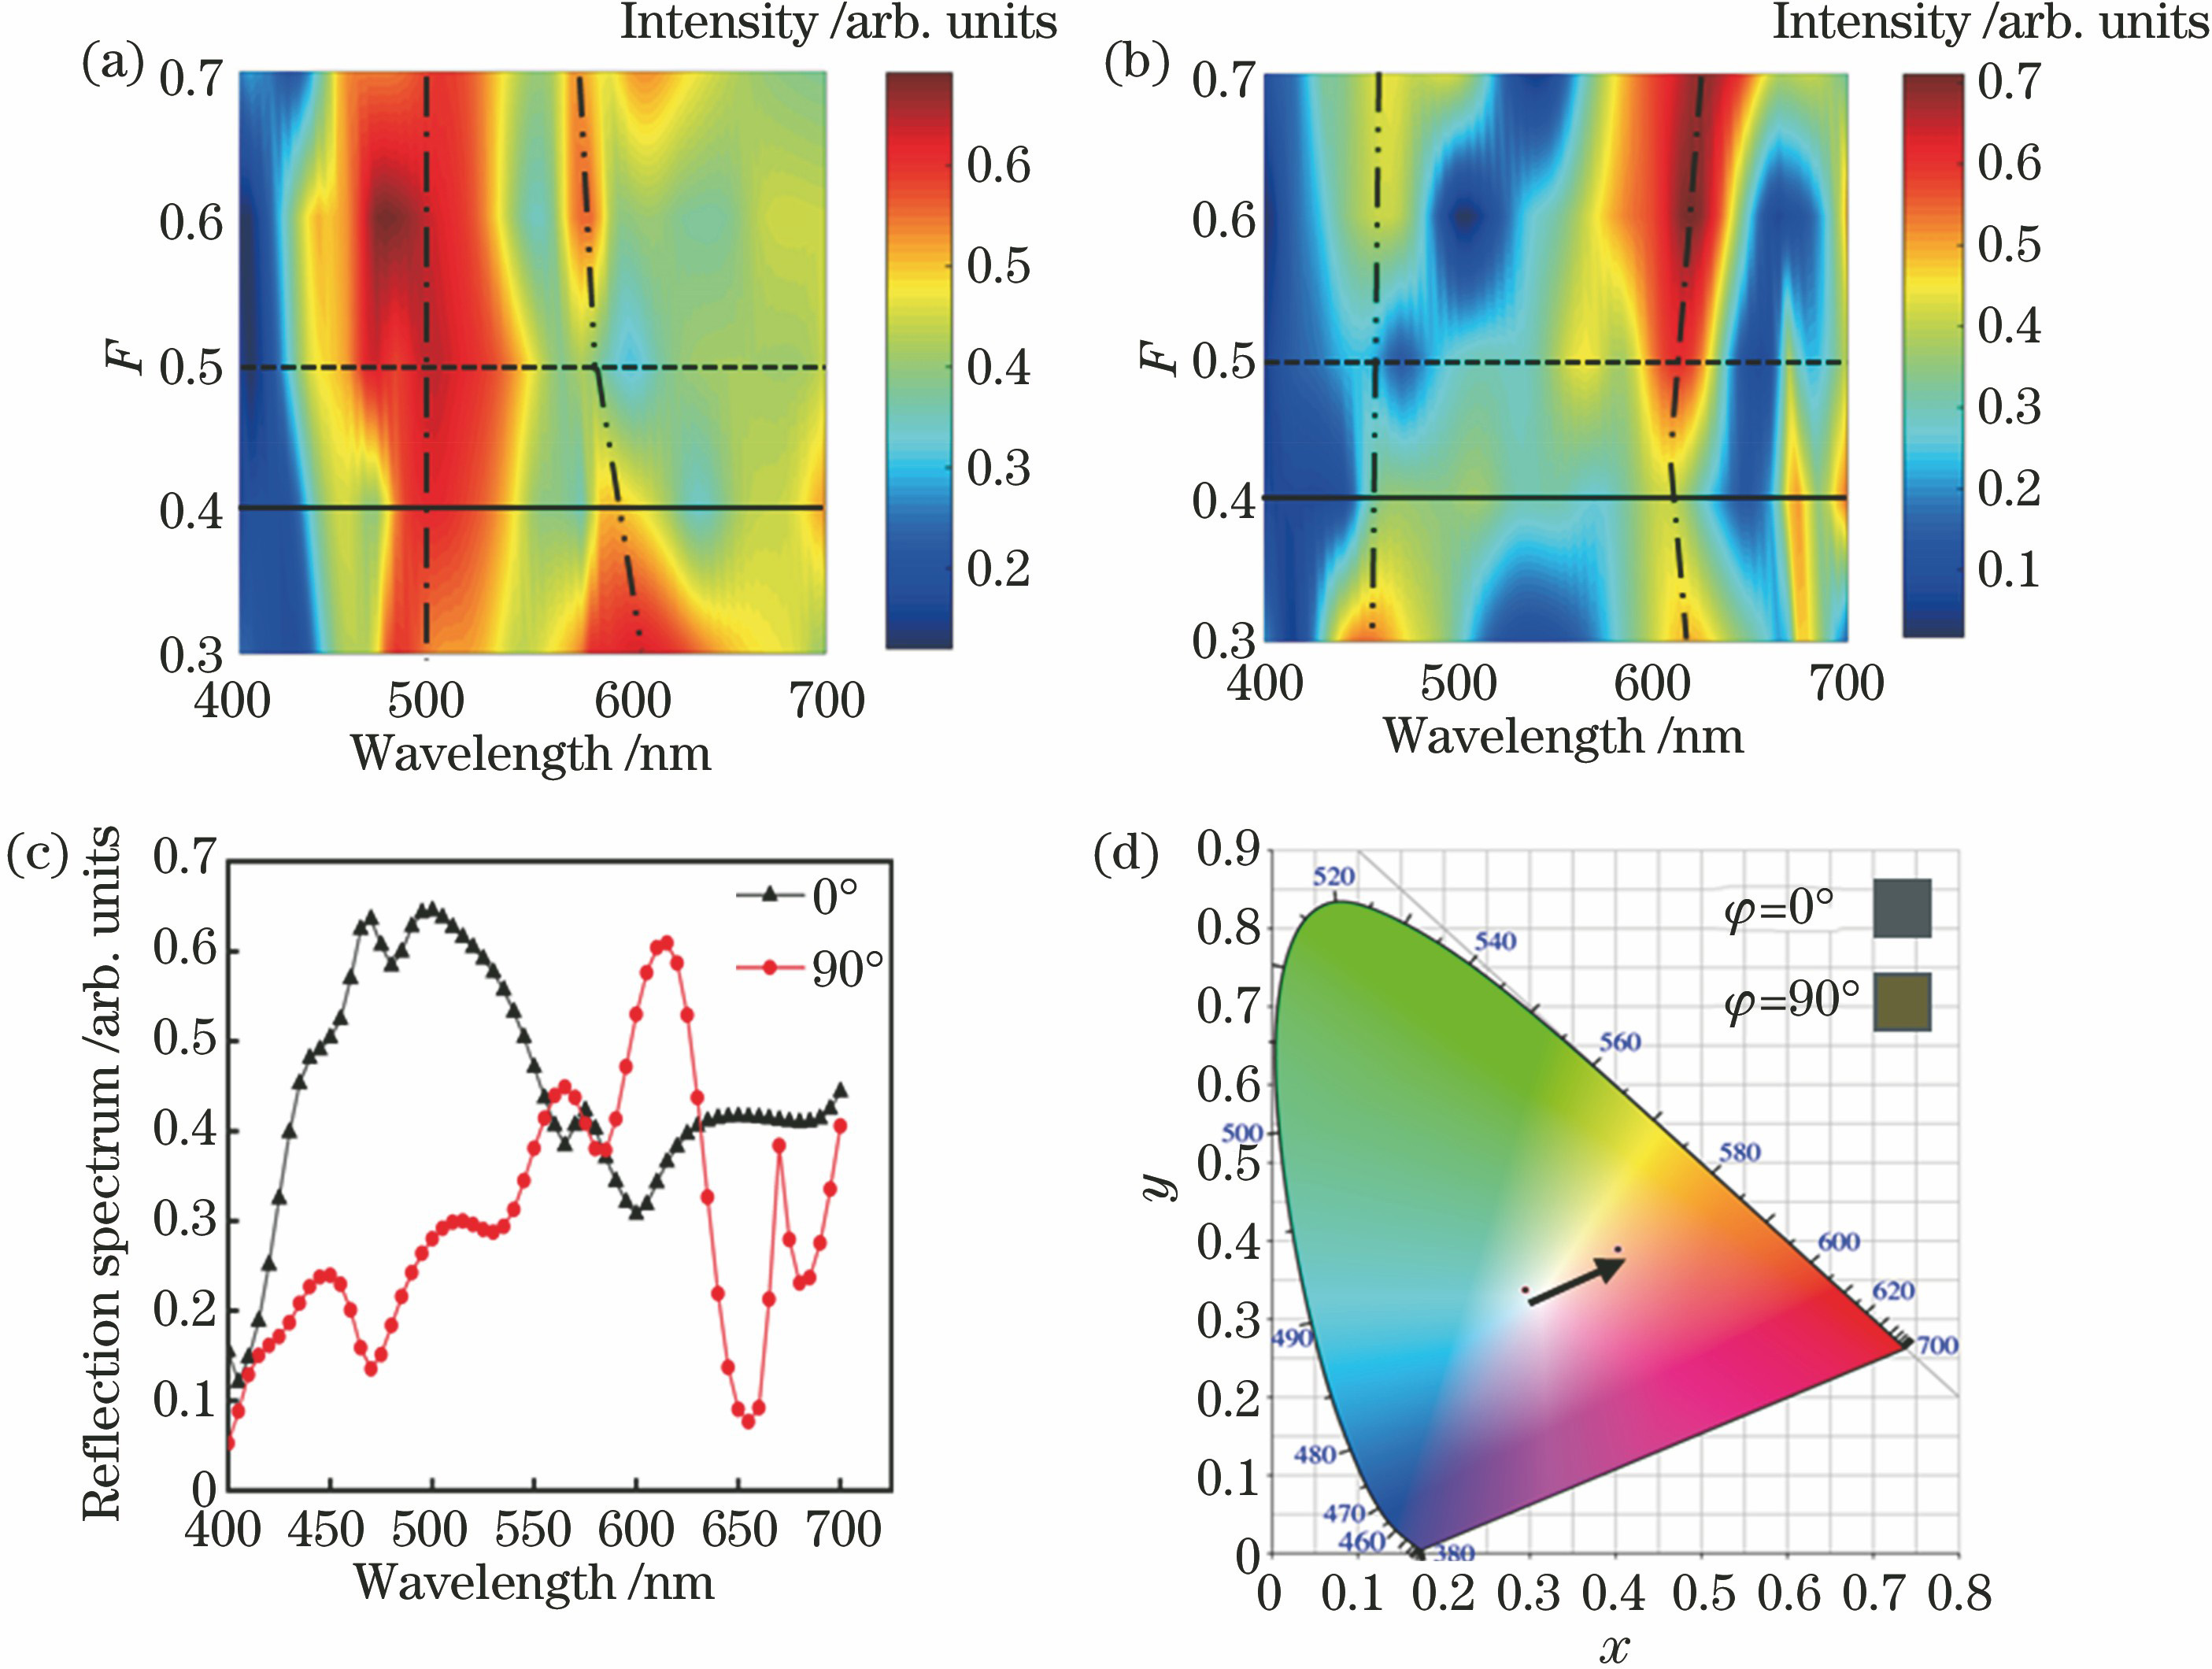
Fig. 2. Reflection spectrum corresponding to the duty cycle change, optimized reflection spectrum and its color gamut diagram. (a) Plane reflection spectrum at φ=0°; (b) plane reflection spectrum at φ=90°; (c) optimized reflection spectrum of the two planes; (d) CIE1931 color gamut diagram corresponding to the reflection spectrum
Fig. 3. Reflection spectrum corresponding to the change of grating height, optimized reflection spectrum and its color gamut diagram. (a) Reflection spectrum at φ=0°; (b) reflection spectrum at φ=90°; (c) optimized reflection spectrum of the two planes; (d) CIE1931 color gamut diagram corresponding to the reflection spectrum
Fig. 4. Reflection spectrum corresponding to changes in dielectric layer thickness, optimized reflection spectrum and its color gamut diagram. (a) Reflection spectrum at φ=0°; (b) reflection spectrum at φ=90°; (c) optimized reflection spectrum of the two planes; (d) CIE1931 color gamut diagram corresponding to the reflection spectrum
Fig. 5. Reflection spectrum and color corresponding to the incident angle change. (a) Reflection spectrum at φ=0°; (b) reflection spectrum at φ=90°; (c) CIE1931 color gamut at φ=0°; (d) CIE1931 color gamut at φ=90°
Fig. 6. Electric field intensity distribution maps. (a) TE wave incident at φ=0°; (b) TM wave incident at φ=0°; (c) TE wave incident at φ=90°; (d) TM wave incident at φ=90°
Fig. 7. SEM topography and profile. (a) SEM topography; (b) profile
Fig. 8. Sample reflection color under white light and reflection spectrum. (a) Aample color at φ=0°; (b) sample color at φ=90°; (c) reflection spectrum test curve of the sample in two planes; (d) CIE1931 color gamut diagram corresponding to the sample test curve
Fig. 9. Reflection spectrum of the two planes
Fig. 10. Reflection spectrum corresponding to the change of dielectric refractive index. (a) Reflection spectrum at φ=0°; (b) reflection spectrum at φ=90°

Set citation alerts for the article
Please enter your email address
© Copyright 2018-2021 | Chinese Laser Press. All Rights Reserved 沪ICP备15018463号-20