A micro-angle measurement method based on Fabry-Perot etalon is proposed. Particularly, by calculating the displacement of center of the imaging concentric rings and the focal length of the imaging objective lens, the micro angle of the deflected mirror is obtained. The evaluation model of the micro angle uncertainty, based on the uncertainty components of the center displacement and the focal length of the imaging objective lens, is constructed. The Fabry-Perot etalon with an interval of 2 mm is selected to carry out the experimental research on the measurement of micro angles, and the data is processed. The experimental results indicate that the maximum measurement uncertainty is 0.132" and 0.045" in the range of 600" and 40", respectively. The proposed method can provide a reference for the realization of the self-calibrated, higher-accuracy micro-angle measurement.
Micro-angle measurement technology is widely utilized in the installation of precision mechanical components, precision and ultraprecision machining, as well as aiming and positioning. it is extremely important in the fields of machinery, aerospace, military, and other applications[1]. The photoelectric autocollimator is currently the main technical means to measure micro angles with high precision. It applies the optical autocollimation method to project the deflection angle of the incident light onto the image plane, and the displacement of the light spot is analyzed by the two-dimensional imaging device to measure the deflection angle. The world's leading manufacturers of photoelectric autocollimators are the UK (Taylor Hobson), Germany (MÖLLER-WEDEL), USA (API), and Japan (Nikon). The German ELCOMAT HR photoelectric autocollimation goniometer exhibits the highest precision. Its accuracy can reach 0.02", 0.04", and 0.06" in the range of 10", 40", and 300", respectively. Several studies on high-accuracy micro-angle measurement and related technologies have been conducted. In 2012, TANFER Y et al.[2] developed a high-precision micro-angle generator, which can be calibrated for photoelectric autocollimators, with an expanded uncertainty of 0.01" (coverage factor k=2). In 2013, KIM J A et al.[3] proposed a method for correcting the nonlinear error of the segmented circular periodic signal and achieved an uncertainty of less than 0.015". In 2016, HSIEH M C et al. [4] proposed a new optical material and a heterodyne interferometer for micro-angle measurement. In a dynamic range of 0.45°, the angle measurement resolution can be better than 0.252". In 2017, HEIKKINEN V et al.[5] studied a new type of interferometric two-way micro-angle generator with a standard uncertainty of 0.003 6" in the range of 2 000". Although China's angle measurement technology started late, it has achieved promising results. The AUTOMAT5000 photoelectric autocollimator produced by Tianjin Automate Optoelectronics Co., Ltd. has an accuracy of 0.25" and 0.1" in the range of 1 000" and 100", respectively. Its indicators are deemed domestic and of highest value among commercial products. In 2008, the 6 354 Research Institute of China State Shipbuilding Corporation [6] developed a high-precision dual-axis autocollimator with an accuracy of 0.2" in the range of 500″. The EAMP300 autocollimator developed by Beijing Aerospace Metrology and Testing Technology Research Institute in 2019[7] has an accuracy of 0.25" in the range of 1 000". In terms of angle measurement technology, ZHANG Junjie et al.[8] added the magnifying optical path to the optical path of the collimator to amplify the self-collimated image and its displacement and achieved an indication error of ±0.01" and ±0.02" in the range of 10" and 50", respectively. TAN Xinran et al.[9] proposed a micro-angle measurement method based on capacitive sensors, which achieved an accuracy of 0.157" and 0.052" in the range of 900" and 300", respectively. In 2018, WU Yumin et al.[10] proposed a micro-angle measurement method based on a lensless digital holographic microscope with an accuracy of 0.5" in the range of 1 000". In 2019, HE Yun et al.[11] studied a noncontact external right-angle measurement method; its accuracy was better than 0.1" and 0.4" in the range of 3.0" and 8.0", respectively. Obviously, there is still a significant gap in the research and development of domestic micro-angle products between countries.
This paper innovatively proposes a micro-angle measurement method based on Fabry-Perot (F-P) etalon. By calculating the displacement of the centers of the imaging concentric rings and the focal length of the imaging objective lens, a self-calibrating micro-angle measurement with high accuracy was realized. Moreover, an evaluation model of the uncertainty of micro-angle measurement was established.
1 Micro-angle measurement principle based on F-P etalon
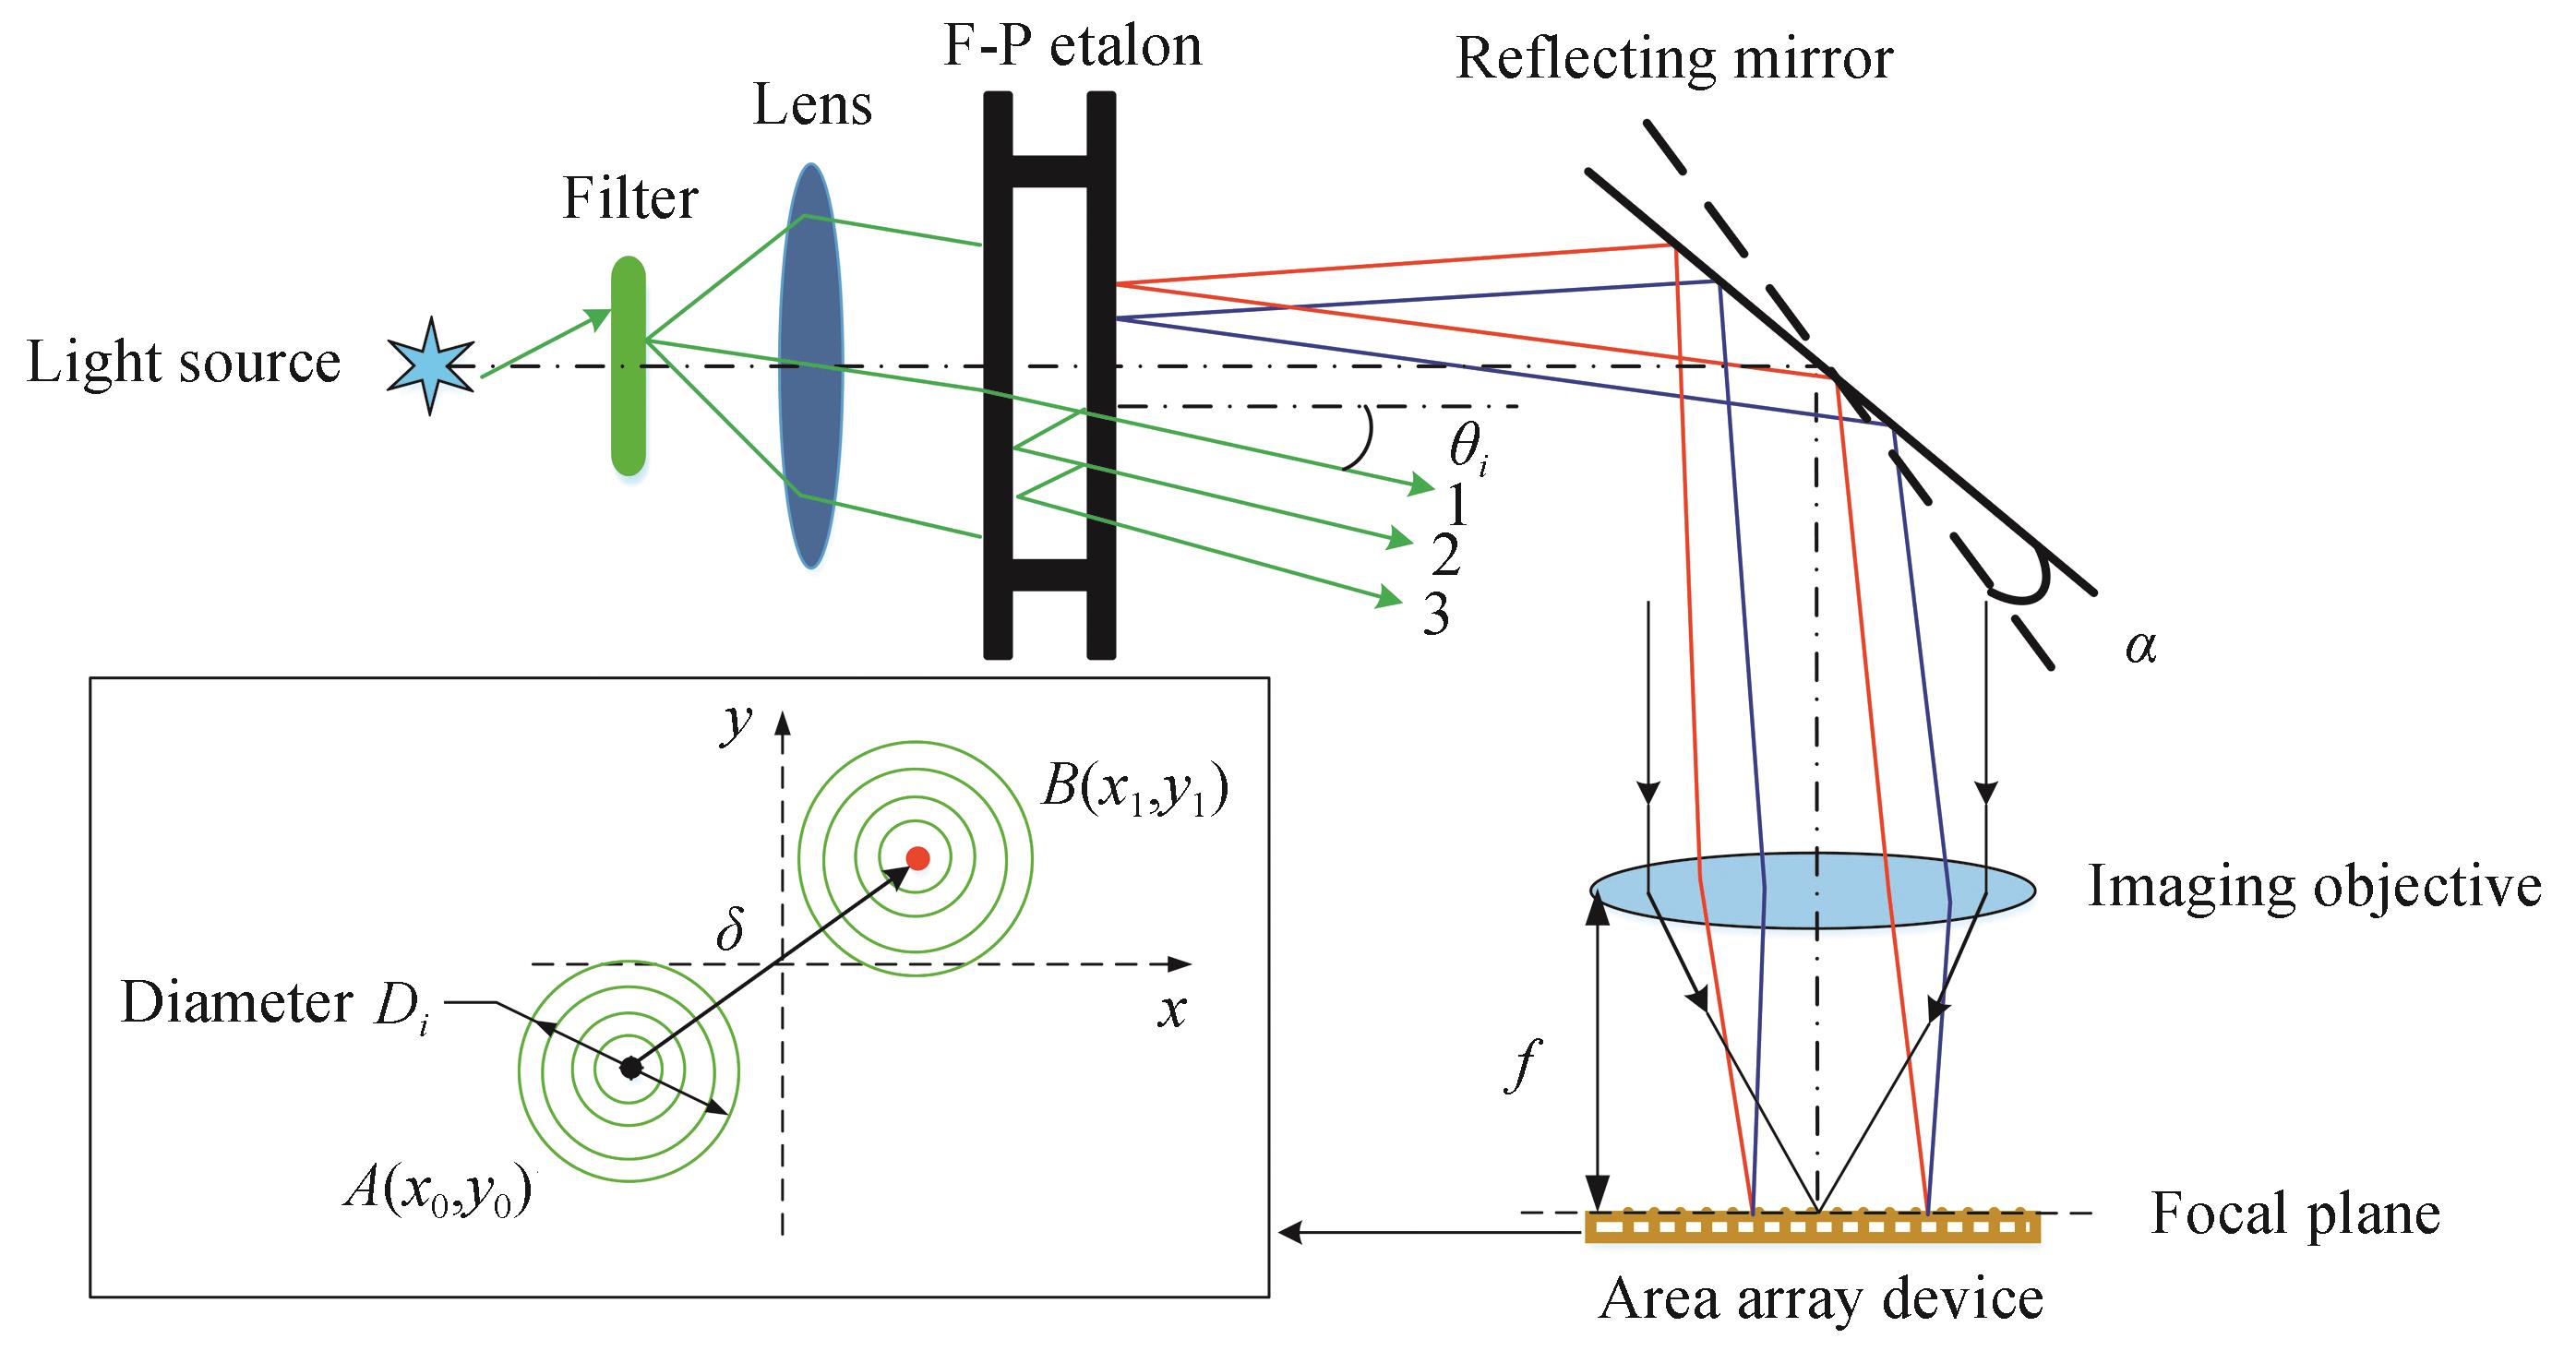
The micro-angle measurement optical path based on F-P etalon is shown in Fig.1. The point light source passes through the interference filter to produce quasi-monochromatic light with a known vacuum wavelength , which, in turn, passes through the condenser lens to form a high-intensity extended light source, and subsequently passes through the F-P etalon with the clearance of d and a refractive index of n. After tooling, a series of standard cone beams with cone angle are produced. The conical beam passes through the reflected mirror and the imaging objective lens and forms several Concentric Interference Rings (CIRs) with a diameter of Di on the area array device at the focal plane. The conical beam passes through the reflected mirror and the imaging objective lens, forming several CIRs on the area array device at the focal plane. is the series cone angle between the conical beam and the conical axis perpendicular to the exit surface of the etalon. is the serial number of the CIR. The first circle from the center is marked as . is the integer part of the smallest interference order of ; the interference order is
Figure 1.Micro-angle measurement optical path based on F-P etalon
where is the fractional part of the interference order corresponding to , with .
When the reflected mirror rotates through a micro angle , the reflected beam tilts by , and the position of the CIR on the rear array of the imaging objective corresponds to a micro center displacement . The coordinates of the center of the circle before and after the angular deflection are and , respectively. Therefore, and its standard deviation are respectively
where ,,,, are the average pixel coordinates with spacing as the relative unit, and ,,, are the standard deviations of ,,,. From the classical optical principle, the cone angle and the focal length of the imaging objective lens determine the diameter of the series of imaging concentric rings, and the specific relationship is[12]
According to Eq. (1) and (4), the diameter of the CIR and the corresponding ring number are fitted with the least squares straight line, and the focal length of the imaging objective lens is
The relative expanded uncertainty of is
where is the average pixel interval as the relative unit, is the expansion factor obtained under the confidence probability and effective degrees of freedom, is the standard deviation of , and is the uncertainty introduced by the focus error limit of the area array acquisition device. is the uncertainty component introduced by the average pixel pitch. According to the principle of geometric optics, , , and of the reflected mirror are related as . To realize the self-calibration feature and reduce the measurement error as much as possible, the average pixel spacing is regarded as the relative unit, and the micro-angle calculation equation using the relative measurement principle is
The accurate measurement of and is the key to the measurement of . The research group has initially completed the related research on the measurement of and [13-14]. Fig.2 shows the basic process for measuring and .
Figure 2.Basic process of lens focal length and center micro-displacement measurement
First, perform virtual pixel subdivision and signal smoothing on the collected CIR image. The subdivided virtual pixel spacing is reduced to the original spacing . After smoothing, the influence of stochastic undetermined system error is reduced. Afterwards, the local multiple regression of peak position coordinates is performed to reduce the influence of pixel geometric error and photoelectric conversion rate error caused by various factors. Finally, the circular regression and multi-chord averaging method are used to obtain the ring information. From the ring information, the coordinates of the center of the circle and its standard deviation as well as the diameter of the ring and its standard deviation can be calculated. We calculate and from Eq. (2) and (3) and compare with the laser phase modulation differential interferometer to verify that the measurement of can reach submicron level. The focal value of the imaging objective lens and the value of are calculated by Eq. (5) and (6), respectively. Implementing the decimal repetition method[15] to measure the F-P etalon with the clearance of accurately, we obtain the CIR information generated by the three different wavelengths after passing through the F-P etalon, calculate the ring diameter by circular regression, and apply mathematical statistics to calculate and find . The self-calibration of the measurement can be realized.
2 Establishment and analysis of uncertainty evaluation model of micro-angle measurement
2.1 Uncertainty evaluation model of micro-angle measurement
According to Eq. (8), utilizing the indirect measurement method[16], the deflection of the relative change of the ring center's is
The deviation of the deflection to is calculated as
Owing to the existence of when the independent component standard deviation is synthesized, the standard deviation of () and () is . After a slight magnification, the expanded uncertainty of can be written as
where is the distribution factor and is the degree of freedom when seeking , can be obtained when applying the multiple regression mathematical statistics method to derive the position of the ring point, and is the effective degree of freedom[17].
According to Eq. (11), the measurement uncertainty of the rotation is
where the sum component is related to the synthetic standard uncertainty of and , the magnification component is related to the synthetic standard uncertainty of . is the effective degree of freedom of to the uncertainty of the synthetic standard, and is the effective degree of freedom of to the uncertainty of the synthetic standard. According to the Ref.[12], the effective resolution of the rotation is .
2.2 Expanded uncertainty of center displacement
The expanded uncertainty of is . mainly includes the uncertainty component introduced by the repeatability standard deviation of the circle center coordinate, the uncertainty component introduced by the deviation of the area array device from the focal plane, the uncertainty introduced by the idle distance error in the measurement system, and the certainty component and the uncertainty component introduced by the ambient temperature gradient distribution. Since the influencing variables are independent and uncorrelated, the expanded uncertainty expression of is
where ,,, are the corresponding degrees of freedom of ,,,, respectively.
1) In the same experiment, the arithmetic mean of the standard deviation of corresponding to all values is taken as the repeatability standard deviation of the center coordinate.
2) When there is an angle between the area array device and the focal plane position, the interference image received by the area array device changes, causing the ring to be elliptical and affecting the accuracy of the center measurement. We suppose that the deflection center offset of the area array device occurs and calculate the uncertainty component according to the uniform distribution.
3) Idle distance error refers to the change of the optical path of the beam in the F-P etalon owing to changes in the external environment, which affects the measurement result. We define the idle time error . is the change value of the refractive index of the air before and after the environmental change. The F-P etalon with the clearance of is calculated by the decimal repetition method; the uncertainty component is calculated according to the uniform distribution.
4) The change of the environmental temperature gradient will cause the drift of the pixels to different positions of the area array. We define the amount of environmental gradient change, where is the linear expansion coefficient of the area array substrate, is the diameter of the ring involved in the calculation, and is the temperature change. The uncertainty component is calculated according to the uniform distribution.
2.3 Expanded uncertainty of the focal length of the imaging objective lens
The expanded uncertainty of and mainly includes the uncertainty component introduced by the measurement repeatability standard deviation of and the uncertainty component introduced by the focus error limit. Since the influence quantities are independent and unrelated, the expanded uncertainty expression of is
Among them, and are the degrees of freedom corresponding to and , respectively.
1) The standard deviation of is , therefore, .
2) If the area array device cannot be accurately located before and after the focal plane, the image collected by the area array device is not the clearest. According to the Ref.[13], before the measurement of , the focus experiment is carried out, the half maximum value of the shooting circle is calculated, and the focus error limit is determined after regression fitting. Hence, .
3 Micro-angle measurement experiment
3.1 Experimental device and interference image acquisition
The measuring device of is shown in Fig.3. The pen-shaped low-pressure mercury lamp as well as the mercury lamp light source are placed on the universal adjusting bracket. The light emitted by the light source passes through the interference filter to form a quasi-monochromatic light, which, in turn, is transmitted through the condensing lens, making the light source an expanded light source with higher intensity. The multi-directional incident light in a certain solid angle range from the expanded light source is transmitted through the F-P etalon to produce a standard coaxial conical beam, which passes through the reflected mirror and the industrial fixed focus lens successively to form a CIR. The center wavelength of the interference filter is about 546 nm, and the F-P etalon with the clearance of . is generated by the angle rotating table on the PrismMaster® 150 MAN goniometer, the angle measurement accuracy is ±1.2". The flatness of the reflected mirror is better than . The measured objective lens model is HIKVISIONMVL-LF8040M-F 80 mm industrial fixed-focus lens, the camera adopts the HIKVISIONMV-CH430-90XM industrial camera, the area array size is 22.16 mm×15.22 mm, the area array pixel number is 7 904×5 432, and the average pixel spacing of the area array is μ.
After constructing the experimental device according to Fig.3, adjust the light path to be coaxial to ensure that the light intensity distribution that can be received on the area array device (industrial camera) is uniform. By adjusting the focus, we ensure that the best ring picture is rendered. When the angle rotating table produces a slight rotation (The angle rotating table only needs to produce an angle that meets the required range), of the reflected mirror changes accordingly, and the position of the ring collected by the area array device (industrial camera) changes. Through the data processing of the images before and after the position of the ring changes, is calculated. Fig.4 depicts a CIR with a wavelength of 546 nm rendered by an industrial camera. Fig.4 (a) shows the original CIR image, which is deployed for the subsequent calculation of and center coordinates, and Fig.4 (b) shows the high-brightness CIR image, which is convenient for observation.
Figure 4.Concentric interference ring at 546 nm wavelength
First,we judge the image quality of CIRs. The clarity of CIR and the degree of ring ellipse directly affect the subsequent data processing calculation. The Full Width at Half Maximum (FWHM) of the ring represents the phase difference when the photoelectric signal is half the maximum value. By adjusting the focus ring of the camera lens and calculating the FWHM of the ring, the best focus position is found, and the image is positioned onto the focal plane, making the ring clearest. Table 1 shows the FWHM values and their average values of CIR in the four directions of ,,, under different focusing positions .
Position
0
10.225
8.843
11.422
18.467
12.239
1
8.945
7.625
11.026
11.681
9.819
2
7.687
7.538
10.428
11.729
9.345
3
6.495
6.451
8.129
13.581
8.664
4
5.607
6.080
6.625
8.668
6.745
5
5.268
6.257
5.823
5.493
5.710
6
5.356
6.001
6.052
5.316
5.681
7
6.816
6.553
8.530
7.064
7.241
8
7.682
6.866
11.664
11.038
9.313
9
9.788
7.517
13.704
13.164
11.043
10
8.785
8.459
20.348
12.068
12.415
Table 1. FWHM value under different focusing positions ()
From Table 1, it is obvious that at focus position 6, the average FWHM is minimum and equals to 5.681w. Therefore, since CIR is the clearest when captured at focusing position 6, that focusing position is selected as the best one. By further comparing the closeness of the FWHM values in the four directions at the optimal focusing position, the size of the installation position error of the optical components can be judged, such as the angle between the area array device and the focal plane, and the measurement optical path is not coaxial.
Second, the best ring is selected. In the data processing of measurement, when using the multi-chord averaging method to calculate the ring information, the optimal ring must be selected. According to the CIR data processing method from the Ref.[14], as shown in Fig.5, the virtual pixel subdivision and signal smoothing are performed first, and the x axis and y axis are established in the horizontal and vertical directions of the approximate CIR diameter, respectively. We rotate the Cartesian coordinate system 45° counterclockwise to obtain the , coordinate system, and perform interpolation and signal smoothing. We establish N parallel lines on both sides of the approximate circle diameter of the , axis coordinate system; N is a positive integer. For the same ring, there will be 8N+4 small line segments after the parallel line intersects each ring. The local multiple regression method is applied to obtain the accurate peak coordinate value and peak coordinate standard deviations. By calculating the mean value of the standard deviation of the respective peak position coordinates of all the circles, the optimal circle is determined. As shown in Table 2, the minimum mean value of the standard deviation of the peak coordinates of the 12th ring is ( is the pixel interval after the virtual pixel subdivision and signal smoothing). Therefore, the 12th ring is selected as the optimal ring, and the peak position coordinates on the optimal ring are deployed to calculate and , and finally an value with high accuracy is obtained.
Figure 5.Schematic diagram of circle data processing
According to the imaging position of the CIR on the area array device, a certain number of rings can be collected when the angle rotating table rotates in 600". Because of the measurement, the measured value of the of the industrial fixed focus lens is stable in a certain range, the CIR shot at the initial position of the angle rotation stage is exploited to calculate . In the experiment, the temperature is 24.6 ℃ and the humidity is 65%. Along the same direction, we rotate once every 100" interval and take one shot every 1 min before each rotation. A total of three shots are taken to verify the repeatability of the measurement and complete the 600" measurement experiment. As shown in Table 3, according to the shooting time, the position and the number of times are marked with the serial number. For example, the serial number of the first shot at position 0 is marked as 0-1. For the sake of convenience, the unit of the measured has been converted to millimeters, and are converted to micrometers, and the measured is evaluated using .
No.
/mm
/μm
/μm
/(″)
/(″)
0-1
78.18
0.014
0.157
0.012
0.207
0.041
0-2
0.269
0.012
0.354
0.041
0-3
0.263
0.012
0.348
0.041
1-1
76.991
0.014
101.567
0.056
1-2
77.169
0.013
101.802
0.056
1-3
77.237
0.012
101.891
0.056
2-1
153.655
0.014
202.701
0.071
2-2
153.699
0.013
202.759
0.071
2-3
153.806
0.013
202.900
0.071
3-1
230.224
0.012
303.710
0.087
3-2
230.291
0.012
303.800
0.087
3-3
230.434
0.013
303.988
0.087
4-1
306.901
0.012
404.863
0.102
4-2
306.958
0.012
404.937
0.102
4-3
307.099
0.011
405.123
0.102
5-1
383.563
0.012
505.993
0.117
5-2
383.611
0.012
506.057
0.117
5-3
383.819
0.012
506.330
0.117
6-1
460.229
0.012
607.128
0.132
6-2
460.323
0.012
607.252
0.132
6-3
460.297
0.012
607.217
0.132
Table 3. Experimental results of 600″ inner angle measurement
According to the measurement principle of CIR pictures before and after the rotation (Section 1), , , , and are calculated. is calculated by Eq. (7). According to the measurement uncertainty evaluation model (Section 2.1), the measurement uncertainty is calculated by Eq. (12), and the effective resolution of the rotation is calculated. Table 4 shows the calculation of measurement uncertainty.
Measurement uncertainty
Uncertainty component
Expression
Take 15th ,
,
d=2015522.7 nm,,
Cosine of the cone angle of the optimal ring ,
,Optimal ring diameter ,
℃,
,,
,
Table 4. Calculation instructions of measurement uncertainty
The experimental results indicate that is 78.178 mm, is 0.014, and is not more than 14 nm in the range of 600. The measurement uncertainty is less than 0.132 and has good repeatability.
3.4 Experimental results and analysis of 40" internal angle measurement
According to the imaging position of the CIR on the area array device, a certain number of rings can be collected when the angle rotating table rotates in the range of 40. Because of the measurement, the measured value of the industrial fixed focus lens is stable in a certain range, the CIR shot at the initial position of the angle rotation stage is implemented to calculate . In the experiment, the temperature is 24.6℃ and the humidity is 65%. Along the same direction, we rotate once every 10 interval and take one shot every 1 min before each rotation. A total of three shots are taken to verify the repeatability of the measurement and complete the 40 measurement experiment. As shown in Table 4, according to the shooting time, the position and the number of times are marked with the serial number. For example, the serial number of the first shot at position 0 is marked as 0-1. For the sake of convenience, the unit of the measured has been converted to millimeters, and are converted to micrometers, and the measured is evaluated using .
According to the measurement principle of the CIR pictures before and after the rotation (Section 1), , , , and are calculated. is calculated by Eq. (7). According to the measurement uncertainty evaluation model (Section 2), the measurement uncertainty is calculated by Eq. (15), and the effective resolution of the rotation is calculated. Table 5 shows the calculation of measurement uncertainty. The experimental results show that is 78.157 mm, is 0.014, and is not more than 12 nm. The measurement uncertainty is less than 0.045 and has good repeatability.
No.
/mm
/μm
/μm
/(″)
/(″)
0-1
78.157
0.014
0. 163
0.010
0.216
0.038
0-2
0. 162
0.011
0.214
0.038
0-3
0. 138
0.012
0.181
0.038
1-1
7.630
0.012
10.069
0.040
1-2
7.676
0.011
10.129
0.040
1-3
7.550
0.011
9.962
0.040
2-1
15.770
0.011
20.810
0.041
2-2
15.912
0.011
20.996
0.041
2-3
15.939
0.011
21.032
0.041
3-1
24.089
0.012
31.786
0.043
3-2
24.176
0.011
31.901
0.043
3-3
24.181
0.012
31.908
0.043
4-1
32.446
0.012
42.814
0.045
4-2
32.602
0.012
43.020
0.045
4-3
32.516
0.012
42.906
0.045
Table 5. Experimental results of 40″ inner angle measurement
In this paper, we introduced the measurement principle based on F-P etalon multi-beam imaging, built its measurement uncertainty evaluation model, and specifically analyzed the uncertainty components introduced by the measurement of and . Furthermore, we completed the establishment of an measurement experimental device, studied the judgment of the image quality of the CIR and the selection of the optimal ring, and measured and through the data processing of CIR image. Our aim was to attain a high-accuracy measurement of . The results indicated that the measurement uncertainty in the range of 600 and 40 was lower than 0.132 and 0.045, respectively. Moreover, our method has the advantages of simple structure, large measuring range, high accuracy, and self-calibration.
From Eq. (12), it is apparent that the additive component and magnification component of the measurement uncertainty of the decreased with the increase in . When the imaging objective lens with f=300 mm and the large area array were employed, the measurement uncertainty of was reduced to about a quarter of the existing one, and could be expressed as . Therefore, the measurement uncertainty in the range of 600 and 40 could be less than 0.033 and 0.012, respectively. In terms of measurement accuracy and range, our method had better results than ELCOMAT HR photoelectric autocollimation goniometer.
References
[1] Jingang ZHONG, Xianhua ZHANG, Zhixiang JU. Absolute small-angle measurement based on optical feedback interferometry. Chinese Optics Letters, 6, 830-832(2008).
[2] Y TANFER, O BULENT, K NURAY. High precision small angle generator for realization of the SI unit of plane angle and calibration of high precision autocollimators. Measurement Science and Technology, 23(2012).
[3] J A KIM, J W KIM, C S KANG et al. Calibration of angle artifacts and instruments using a high precision angle generator. International Journal of Precision Engineering & Manufacturing, 14, 367-371(2013).
[4] M C HSIEH, J Y LIN, Y F CHEN et al. Measurement of small angle based on a (100) silicon wafer and heterodyne interferometer. Optical Review, 23, 487-491(2016).
[5] V HEIKKINEN, V BYMAN, I PALOSUO et al. Interferometric 2D small angle generator for autocollimator calibration. Metrologia, 54, 253-261(2017).
[6] Junhong GAN, Jiugui ZOU, Guoding JI. Application of area array CCD in dual-axis autocollimator. Infrared and Laser Engineering, 37, 60-62(2008).
[8] Junjie ZHANG, Zhengyang LI, Shenghua YE. Adopting optical amplification to improve the resolution of photoelectric autocollimator. Chinese Journal of Sensors and Actuators, 24, 50-52(2011).
[9] Xinran TAN, Fan ZHU, Chao WANG et al. Improved accuracy of capacitive sensor-based micro-angle measurement with angular-to-linear displacement conversion. Review of Scientific Instruments, 88, 115104(2017).
[10] Yumin WU, Haobo CHENG, Yongfu WEN. High-precision rotation angle measurement method based on a lensless digital holographic microscope. Applied Optics, 57, 112-118(2018).
[11] Yun HE, Qi LIU, Jingjing HE et al. External right-angle measurement using a two-autocollimator system. Applied Optics, 58, 1158-1163(2019).
[12] Henian ZHU, Zhigang XIAO, Yufei HOU et al. A Fabry-Perot etalon method for measuring focal length and rotationangle. CN.
[13] Xiaoyan SHEN, Zhipeng SUN, Jiacheng HU et al. Method for measuring focal length of transmission objective lens based on F-P etalon. Chinese Journal of Scientific Instrument, 39, 1-8(2018).
[14] Xiaoyan SHEN, Xuhui LAN, Henian ZHU et al. Submicron displacement measurement method based on Fabry-Perot etalon. Chinese Journal of Lasers, 46, 1204002(2019).
[15] Xuhui LAN, Xiaoyan SHEN, Zhipeng SUN et al. Subdivision of area array pixels for Fabry-Perot etalon interval measurement. Journal of Applied Optics, 40, 99-104(2019).
[16] Henian ZHU. Lecture on new concept basic physics experiment, 16-17(2013).