• Photonics Research
  • Vol. 11, Issue 4, 600 (2023)
Jiangwei Yan1、2, Xudong Yu1、2, Zheng Vitto Han1、2, Tongcang Li3, and Jing Zhang1、2、*
Author Affiliations
  • 1State Key Laboratory of Quantum Optics and Quantum Optics Devices, Institute of Opto-Electronics, Shanxi University, Taiyuan 030006, China
  • 2Collaborative Innovation Center of Extreme Optics, Shanxi University, Taiyuan 030006, China
  • 3Department of Physics and Astronomy, Purdue University, West Lafayette, Indiana 47907, USA
  • show less
    DOI: 10.1364/PRJ.471547 Cite this Article Set citation alerts
    Jiangwei Yan, Xudong Yu, Zheng Vitto Han, Tongcang Li, Jing Zhang. On-demand assembly of optically levitated nanoparticle arrays in vacuum[J]. Photonics Research, 2023, 11(4): 600 Copy Citation Text show less
    Experimental setup and image of an optically levitated nanoparticle array. (a) The 2D trap array is produced by passing a 1064 nm laser through a pair of orthogonal acousto-optic deflectors (AODs). The laser beams created by the AODs are imaged with a 4f image system onto a high NA (NA=0.95) objective lens, which creates an array of tightly focused optical tweezers in a vacuum chamber. The optical tweezers propagate against gravity. For particle assembly, we use an auxiliary moving tweezer at 1064 nm superimposed on the trap array with a polarized beam splitter (PBS1). This auxiliary beam is deflected by a motor-driven reflective mirror (MRM1). For particle motion detection, we overlap a probe beam at 532 nm with the trapping beams using a dichroic mirror (DM1). This 532 nm beam is deflected by another motor-driven reflective mirror (MRM2) to measure the motion of an arbitrary particle in the array. The 1064 nm trap beams and the 532 nm probe beam after the high NA objective are collimated by an aspherical lens (AL) and separated by another dichroic mirror (DM2) for detecting the motion of trapped nanoparticles. For particle imaging, an imaging beam at 532 nm is used to illuminate the particles orthogonally. The scattered light is collected by the same high NA objective to form an image on a charge-coupled device (CCD). λ/2, half-wave plate; L1–L4, spherical lenses; BD, beam dump. (b) Theoretically simulated intensity distribution of a 3×3 two-dimensional (2D) array of optical tweezers. (c) Image of a 3×3 array of optically levitated nanoparticles. The intensity is normalized.
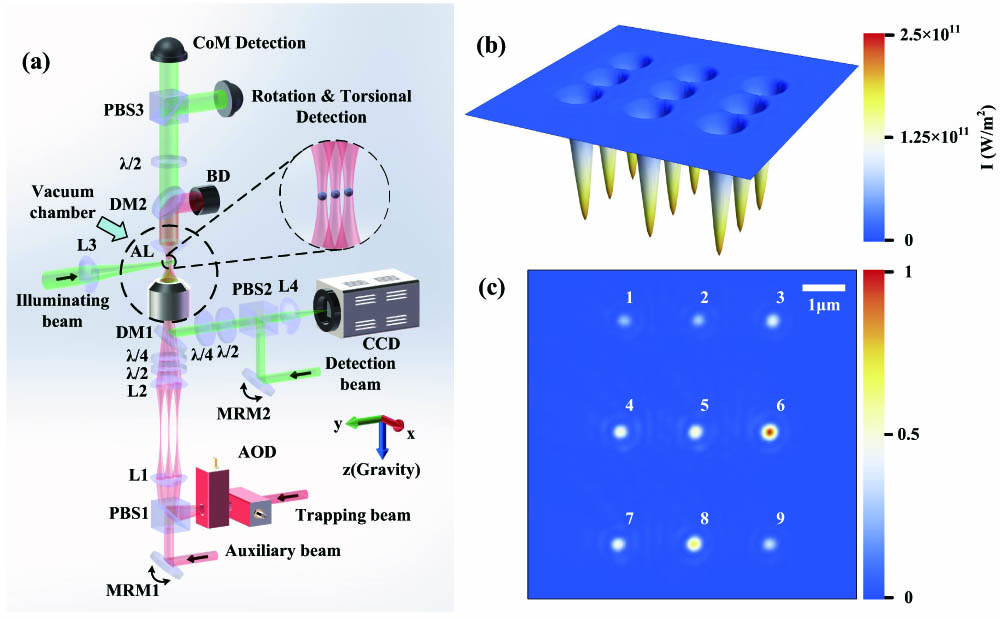
    Fig. 1. Experimental setup and image of an optically levitated nanoparticle array. (a) The 2D trap array is produced by passing a 1064 nm laser through a pair of orthogonal acousto-optic deflectors (AODs). The laser beams created by the AODs are imaged with a 4f image system onto a high NA (NA=0.95) objective lens, which creates an array of tightly focused optical tweezers in a vacuum chamber. The optical tweezers propagate against gravity. For particle assembly, we use an auxiliary moving tweezer at 1064 nm superimposed on the trap array with a polarized beam splitter (PBS1). This auxiliary beam is deflected by a motor-driven reflective mirror (MRM1). For particle motion detection, we overlap a probe beam at 532 nm with the trapping beams using a dichroic mirror (DM1). This 532 nm beam is deflected by another motor-driven reflective mirror (MRM2) to measure the motion of an arbitrary particle in the array. The 1064 nm trap beams and the 532 nm probe beam after the high NA objective are collimated by an aspherical lens (AL) and separated by another dichroic mirror (DM2) for detecting the motion of trapped nanoparticles. For particle imaging, an imaging beam at 532 nm is used to illuminate the particles orthogonally. The scattered light is collected by the same high NA objective to form an image on a charge-coupled device (CCD). λ/2, half-wave plate; L1–L4, spherical lenses; BD, beam dump. (b) Theoretically simulated intensity distribution of a 3×3 two-dimensional (2D) array of optical tweezers. (c) Image of a 3×3 array of optically levitated nanoparticles. The intensity is normalized.
    Rearranging the pattern of a nanoparticle array. (a) Initial pattern of eight levitated nanoparticles in a 4×4 array of optical tweezers. (b), (c) Rearranged patterns of the nanoparticle array. The intensity is normalized.
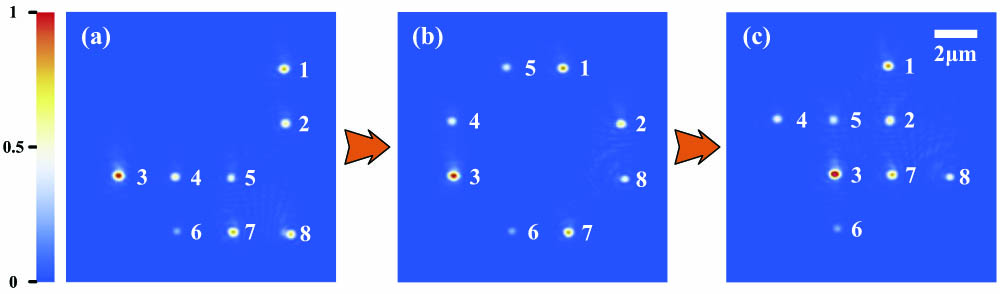
    Fig. 2. Rearranging the pattern of a nanoparticle array. (a) Initial pattern of eight levitated nanoparticles in a 4×4 array of optical tweezers. (b), (c) Rearranged patterns of the nanoparticle array. The intensity is normalized.
    Characterization of each nanoparticle in an optically levitated nanoparticle array. (a) Power spectra of the CoM and torsional motions for the 3×3 trapped nanoparticles as shown in Fig. 1(c) at 2000 Pa. Blue, red, and green traces correspond to power spectra of the CoM motions along the z, x, and y axes, respectively. Pink traces are the power spectra of torsional motions. (b) Damping rates of the CoM motions for the nine trapped nanoparticles as a function of pressure. The dots are measured data, and the solid lines are linear fittings.
    Fig. 3. Characterization of each nanoparticle in an optically levitated nanoparticle array. (a) Power spectra of the CoM and torsional motions for the 3×3 trapped nanoparticles as shown in Fig. 1(c) at 2000 Pa. Blue, red, and green traces correspond to power spectra of the CoM motions along the z, x, and y axes, respectively. Pink traces are the power spectra of torsional motions. (b) Damping rates of the CoM motions for the nine trapped nanoparticles as a function of pressure. The dots are measured data, and the solid lines are linear fittings.
    In situ synthesis of a nanodumbbell by merging two optically levitated nanoparticles. (a) Image of two separated nanoparticles in two optical tweezers. (b) Image of the assembled nanoparticle. The intensity is normalized in (a) and (b). (c)–(f) CoM motion signals and corresponding damping rates as functions of the pressures for nanoparticles 1 and 2, respectively. (g), (h) CoM motion signals and corresponding damping rates as a function of pressure for the assembled nanodumbbell. For (c)–(h), the trapping laser beams are linearly polarized. (i) Rotational frequency of the nanodumbbell as a function of pressure. The dashed line is a boundary of air pressure measurement using two vacuum gauges. The right side of the line is measured via a resistance vacuum gauge, and the left side is the results measured by a thermal gauge. (j) Rotational signal of the assembled nanodumbbell at 0.06 Pa. The frequency of the rotation signal directly measured by the detection system is twice the rotation frequency [17–20" target="_self" style="display: inline;">–20]. For (i) and (j), the trapping laser beam is circularly polarized.
    Fig. 4. In situ synthesis of a nanodumbbell by merging two optically levitated nanoparticles. (a) Image of two separated nanoparticles in two optical tweezers. (b) Image of the assembled nanoparticle. The intensity is normalized in (a) and (b). (c)–(f) CoM motion signals and corresponding damping rates as functions of the pressures for nanoparticles 1 and 2, respectively. (g), (h) CoM motion signals and corresponding damping rates as a function of pressure for the assembled nanodumbbell. For (c)–(h), the trapping laser beams are linearly polarized. (i) Rotational frequency of the nanodumbbell as a function of pressure. The dashed line is a boundary of air pressure measurement using two vacuum gauges. The right side of the line is measured via a resistance vacuum gauge, and the left side is the results measured by a thermal gauge. (j) Rotational signal of the assembled nanodumbbell at 0.06 Pa. The frequency of the rotation signal directly measured by the detection system is twice the rotation frequency [1720" target="_self" style="display: inline;">20]. For (i) and (j), the trapping laser beam is circularly polarized.
    Direct imaging of a 3×3 laser beam array on the CCD.
    Fig. 5. Direct imaging of a 3×3 laser beam array on the CCD.
    Scattering images of the trapped nanoparticle arrays. (a) 1×11 1D array of optically levitated nanoparticles. (b) 2×6 2D array of optically levitated nanoparticles.
    Fig. 6. Scattering images of the trapped nanoparticle arrays. (a) 1×11 1D array of optically levitated nanoparticles. (b) 2×6 2D array of optically levitated nanoparticles.
    SEM image of the nanoparticles used in our experiment. The bar is 1 μm.
    Fig. 7. SEM image of the nanoparticles used in our experiment. The bar is 1 μm.
    Evolution of the intensity distribution versus the distance of the two traps. (a)–(d) Intensity distribution in the x–y plane. (e)–(h) Intensity distribution in x axis.
    Fig. 8. Evolution of the intensity distribution versus the distance of the two traps. (a)–(d) Intensity distribution in the xy plane. (e)–(h) Intensity distribution in x axis.
    Four different situations for the two nanoparticles merged to a single trap.
    Fig. 9. Four different situations for the two nanoparticles merged to a single trap.
    Jiangwei Yan, Xudong Yu, Zheng Vitto Han, Tongcang Li, Jing Zhang. On-demand assembly of optically levitated nanoparticle arrays in vacuum[J]. Photonics Research, 2023, 11(4): 600
    Download Citation