
Dengqiang Zhang, Xiaohan Liu, Yanwei Pang. Reconstruction of Magnetic Resonance Images Based on Dual-Domain Crossed Codec Network[J]. Laser & Optoelectronics Progress, 2022, 59(12): 1210014
- Laser & Optoelectronics Progress
- Vol. 59, Issue 12, 1210014 (2022)
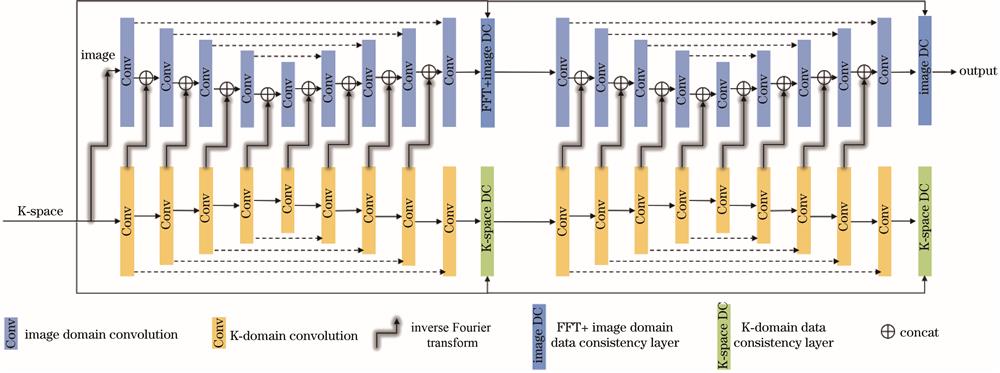
Fig. 1. Cascaded dual-domain crossed encoding and decoding network structure
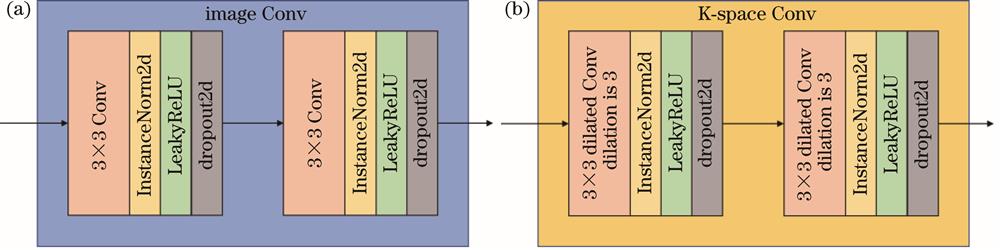
Fig. 2. Image-domain and K-domain convolution structures. (a) Image-domain convolution; (b) K-domain convolution
Fig. 3. Dual domain cascaded modes. (a) Parallel cascade; (b) crossed cascade
Fig. 4. Comparison of 4-fold under-sampled and full-sampled K-domain data visualization.(a) Under-sampled K-space; (b) full-sampled K-space
Fig. 5. Reconstruction results of under-sampled MRI. (a) 4× under-sampled zero-filled magnetic resonance images; (b) magnetic resonance images reconstructed by U-Net; (c) magnetic resonance images reconstructed by DPC-Net; (d) magnetic resonance images reconstructed by KIKI-Net; (e) full-sampled true value
Fig. 6. Reconstruction error. (a) 4× under-sampled zero filled MRI error; (b) reconstruction error of U-Net; (c) reconstruction error of DPC-Net; (d) reconstruction error of KIKI-Net
|
Table 1. Performance comparison of two cascaded methods
|
Table 2. Performance comparison of loss function weights in reconstruction
| ||||||||||||||||||||||||||||||||||||||||||||||||||||||||||||||
Table 3. Objective indicators of reconstruction results of cascaded dual-domain codec network
|
Table 4. Reconstruction performance of different networks under different acceleration magnifications

Set citation alerts for the article
Please enter your email address
© Copyright 2018-2021 | Chinese Laser Press. All Rights Reserved 沪ICP备15018463号-20