
Yunjing Ji, Siyue Du, Yang Song, Zhenhua Li. Research on 3-D vision measurement technology based on line structured light rotating scanning and laser stripe repair[J]. Infrared and Laser Engineering, 2022, 51(2): 20210894
- Infrared and Laser Engineering
- Vol. 51, Issue 2, 20210894 (2022)
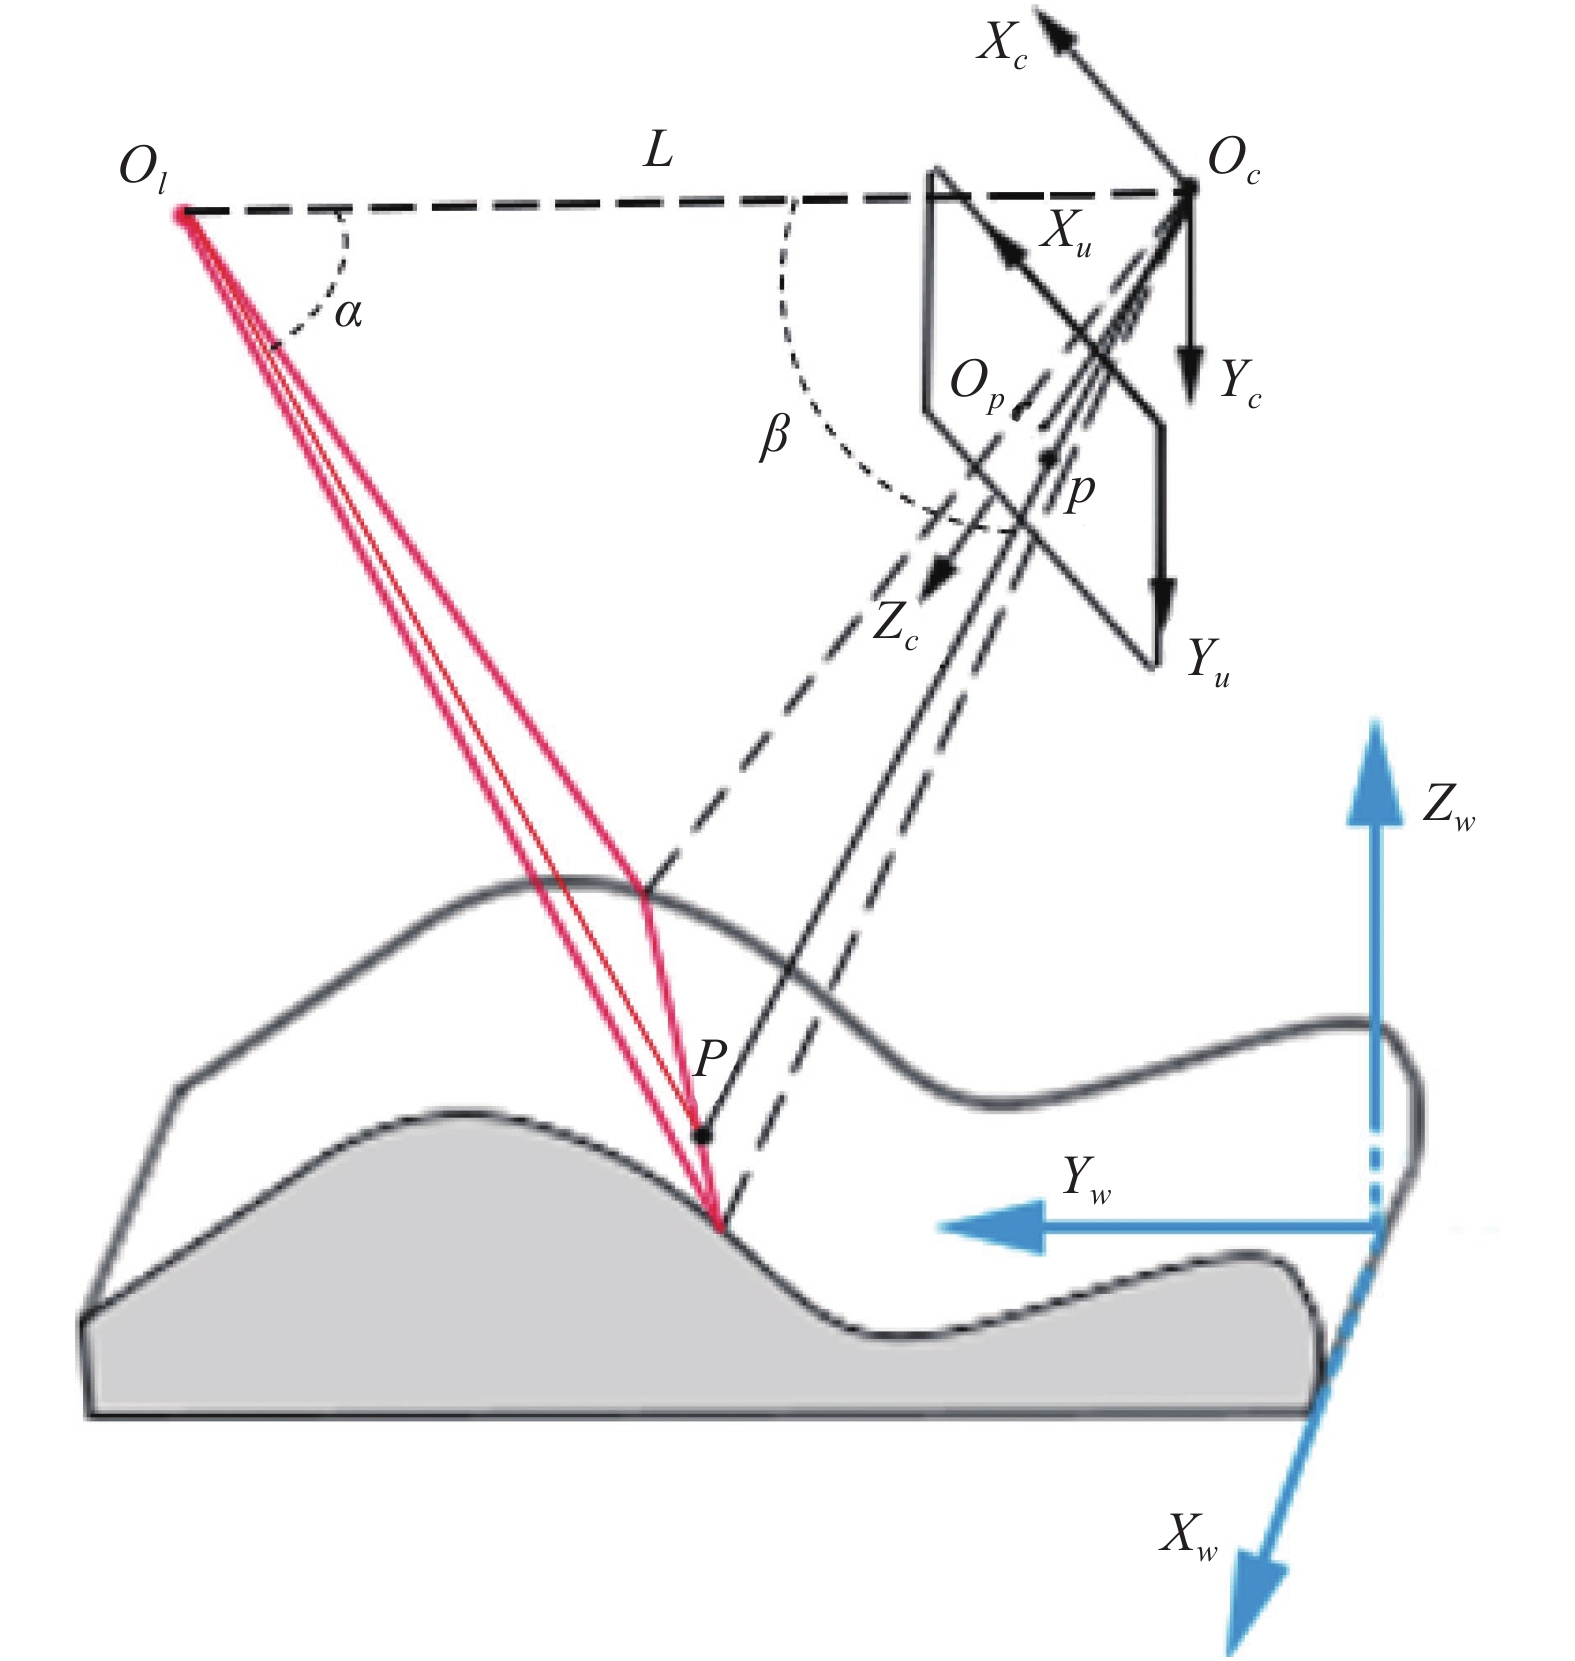
Fig. 1. Mathematical model of line structured light 3-D vision measurement
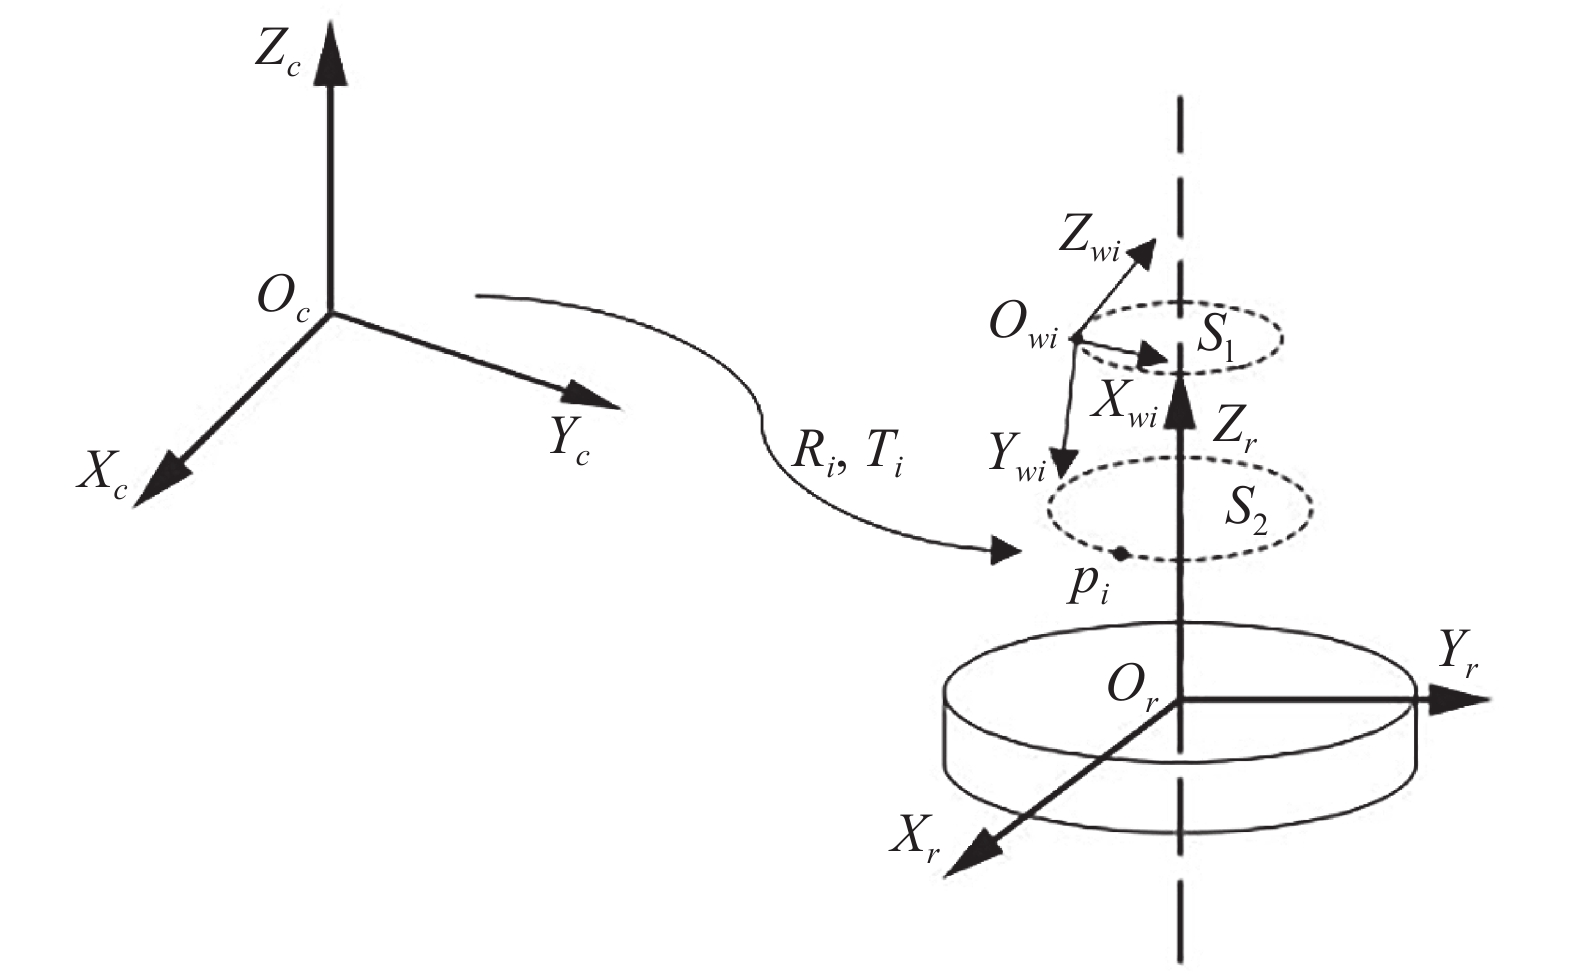
Fig. 2. Schematic diagram of rotating scan center axis calibration
Fig. 3. Algorithm flow chart of extracting laser stripe centerline in this paper
Fig. 4. Laser stripe centerline extraction algorithm in this paper. (a1), (a2) Gray-scale image of laser stripe on the welding seam of a metal hub; (b1), (b2) Preliminary gray centroid method to extract the centerline of laser stripe; (c1), (c2) Frame selection of missing segments; (d1), (d2) Adaptive gray-scale enhancement to repair missing segments; (e1), (e2) Gray centroid method to completely extract the centerline of laser stripe
Fig. 5. 3-D vision measurement scheme in this paper
Fig. 6. 3-D vision measurement steps based on line structured light rotation scanning
Fig. 7. (a) Physical drawing of measured metal hub; (b) Experimental diagram
Fig. 8. 3-D contour reconstruction renderings of the wheel hub
Fig. 9. Repeated measurement results of the maximum radius of the outer contour of the hub
Fig. 10. Repeatability error of the maximum radius of the outer contour of the hub
|
Table 1. Vision module calibration parameters
|
Table 2. Standard bat measurement results

Set citation alerts for the article
Please enter your email address
© Copyright 2018-2021 | Chinese Laser Press. All Rights Reserved 沪ICP备15018463号-20