• Photonics Research
  • Vol. 9, Issue 12, 2511 (2021)
Yingzhi Li1, Baisong Chen1, Quanxin Na2, Qijie Xie2, Min Tao1, Lanxuan Zhang1, Zihao Zhi1, Yuxuan Li1, Xiaobin Liu1, Xianshu Luo3, Guoqiang Lo3, Fengli Gao1, Xueyan Li1, and Junfeng Song1、2、*
Author Affiliations
  • 1State Key Laboratory on Integrated Optoelectronics, College of Electronic Science and Engineering, Jilin University, Changchun 130012, China
  • 2Peng Cheng Laboratory, Shenzhen 518000, China
  • 3Advance Micro Foundry Pte. Ltd., Singapore 117685, Singapore
  • show less
    DOI: 10.1364/PRJ.437846 Cite this Article Set citation alerts
    Yingzhi Li, Baisong Chen, Quanxin Na, Qijie Xie, Min Tao, Lanxuan Zhang, Zihao Zhi, Yuxuan Li, Xiaobin Liu, Xianshu Luo, Guoqiang Lo, Fengli Gao, Xueyan Li, Junfeng Song. Wide-steering-angle high-resolution optical phased array[J]. Photonics Research, 2021, 9(12): 2511 Copy Citation Text show less
    (a) Optical microscope image of 128-channel OPA. (b) Scanning electron microscope (SEM) image of a fishbone waveguide grating. (c) SEM image of a chain waveguide grating. (d) Transmission electron microscope (TEM) image of dual-level misaligned waveguide grating with the cladding removed. (e) Schematic of a p−n junction phase shifter. (f) Electrically and optically packaged 128-channel OPA chip.
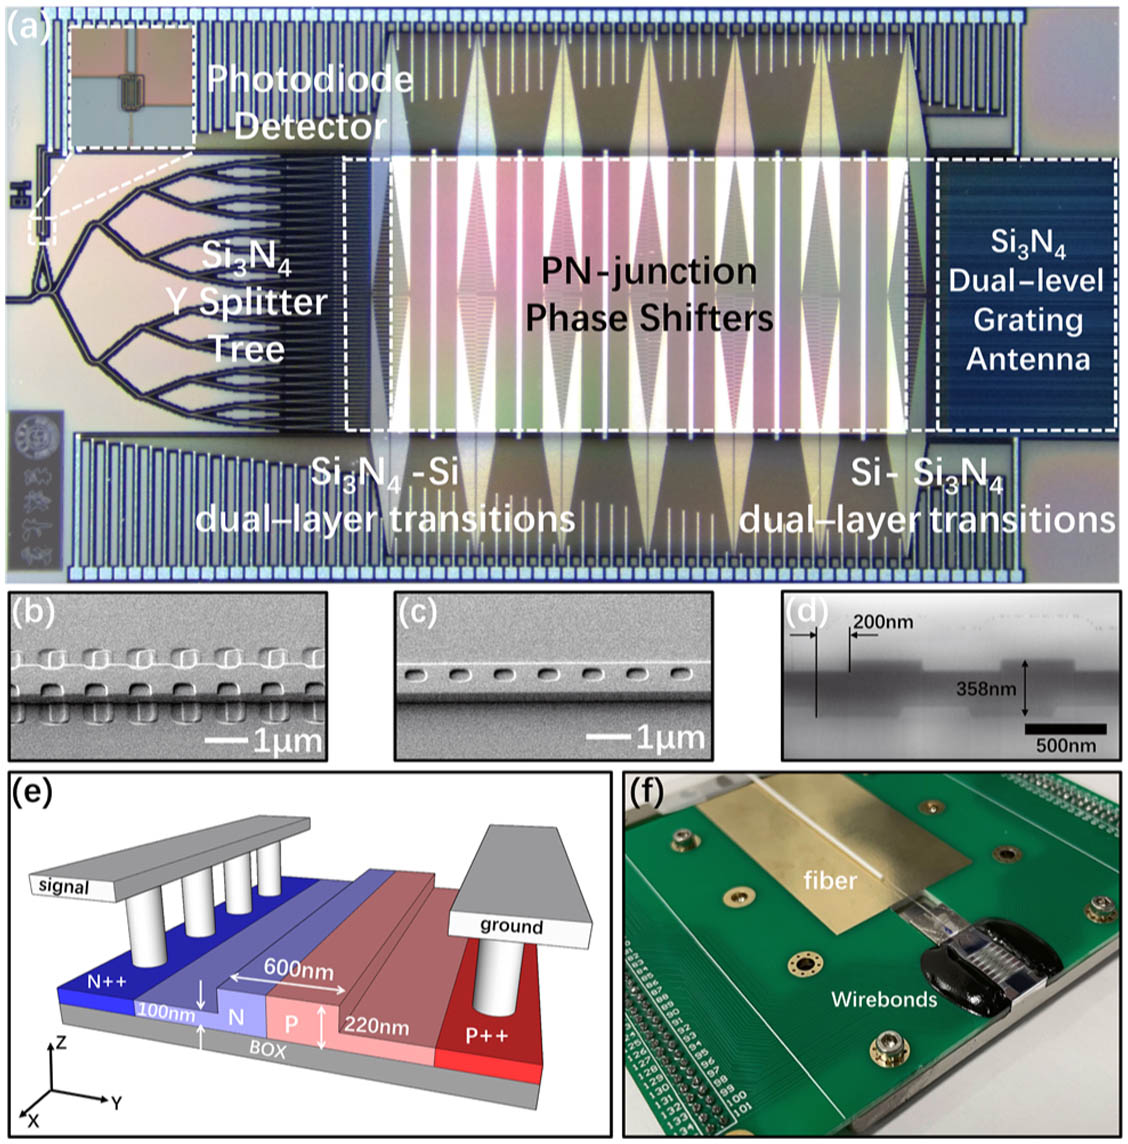
    Fig. 1. (a) Optical microscope image of 128-channel OPA. (b) Scanning electron microscope (SEM) image of a fishbone waveguide grating. (c) SEM image of a chain waveguide grating. (d) Transmission electron microscope (TEM) image of dual-level misaligned waveguide grating with the cladding removed. (e) Schematic of a pn junction phase shifter. (f) Electrically and optically packaged 128-channel OPA chip.
    Simulation results for emitting profiles of the chain and fishbone grating antennas. (a) The plot for FWHM of the emitting profile against etch hole width wp of a single chain waveguide grating; (b) the plot for FWHM of the emitting profile against bone width wb. The insets of (a) and (b) are the cross sections of the chain and fishbone waveguide gratings. (c) and (d) Far-field simulation result in θ of the chain antenna OPA and the fishbone antenna OPA. Different colors represent the beams at different steering angles with 10° step.
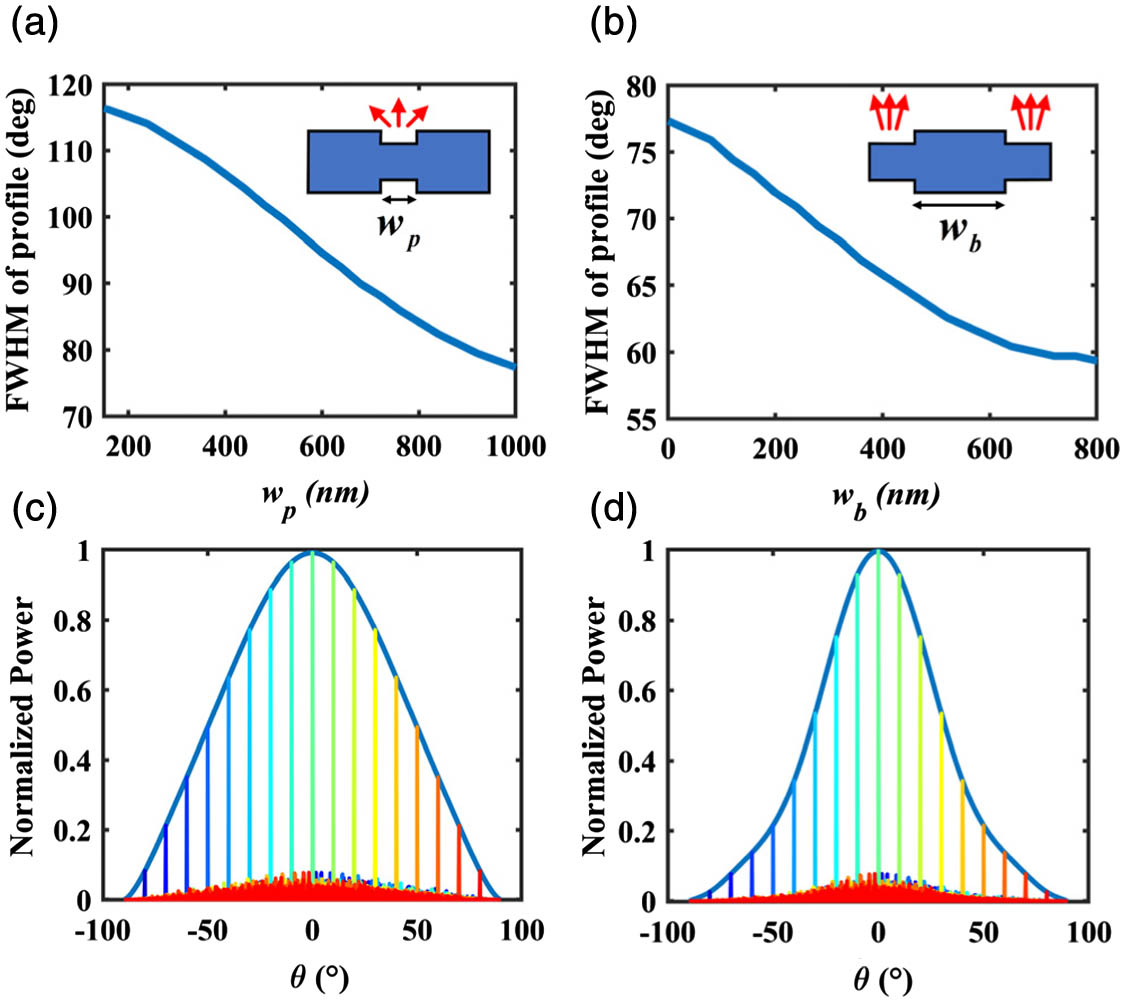
    Fig. 2. Simulation results for emitting profiles of the chain and fishbone grating antennas. (a) The plot for FWHM of the emitting profile against etch hole width wp of a single chain waveguide grating; (b) the plot for FWHM of the emitting profile against bone width wb. The insets of (a) and (b) are the cross sections of the chain and fishbone waveguide gratings. (c) and (d) Far-field simulation result in θ of the chain antenna OPA and the fishbone antenna OPA. Different colors represent the beams at different steering angles with 10° step.
    (a) and (b) Beam steering performance in θ of the chain antenna OPA and the fishbone antenna OPA. For the chain antenna OPA, sidelobe suppression ratio (SMSR) is 10.26 dB when it steers to 0°; for the fishbone antenna OPA, SMSR is 10.63 dB.
    Fig. 3. (a) and (b) Beam steering performance in θ of the chain antenna OPA and the fishbone antenna OPA. For the chain antenna OPA, sidelobe suppression ratio (SMSR) is 10.26 dB when it steers to 0°; for the fishbone antenna OPA, SMSR is 10.63 dB.
    Beam steering performance in ψ of the fishbone antenna OPA and chain antenna OPA.
    Fig. 4. Beam steering performance in ψ of the fishbone antenna OPA and chain antenna OPA.
    (a) and (b) Main beam cross section measurement 15 m away from the chain antenna OPA in the θ direction and ψ direction. (c) and (d) Main beam cross section measurement 15 m away from the fishbone antenna OPA in the θ direction and ψ direction. (e) Thirty-seven separate measurements of the beam steered to different angles in about 1° (see Visualization 1 showing the beam steering in θ). (f) Sum of the normalized far-field spot obtained by the fishbone antenna OPA steering with laser wavelength and phase shifters. The entire pattern forms the letters “JLU” in the 0.4°×0.2° FOV (see Visualization 2 showing the 2D beam steering). The image shown has been stripped of camera background noise to improve image contrast.
    Fig. 5. (a) and (b) Main beam cross section measurement 15 m away from the chain antenna OPA in the θ direction and ψ direction. (c) and (d) Main beam cross section measurement 15 m away from the fishbone antenna OPA in the θ direction and ψ direction. (e) Thirty-seven separate measurements of the beam steered to different angles in about 1° (see Visualization 1 showing the beam steering in θ). (f) Sum of the normalized far-field spot obtained by the fishbone antenna OPA steering with laser wavelength and phase shifters. The entire pattern forms the letters “JLU” in the 0.4°×0.2° FOV (see Visualization 2 showing the 2D beam steering). The image shown has been stripped of camera background noise to improve image contrast.
    (a) and (b) Main beam divergence in the θ direction and power efficiency of the chain antenna OPA and fishbone antenna OPA in different steering angles.
    Fig. 6. (a) and (b) Main beam divergence in the θ direction and power efficiency of the chain antenna OPA and fishbone antenna OPA in different steering angles.
    (a) Schematic of FMCW LIDAR photonic circuit with triangular modulation. (b) Measured beat frequency at various distances with OPA acting as a TX or RX. The inset is the measured beat frequency at various distances at 5 cm intervals. (c) 116 repeated measurements of beat frequency at 100 m.
    Fig. 7. (a) Schematic of FMCW LIDAR photonic circuit with triangular modulation. (b) Measured beat frequency at various distances with OPA acting as a TX or RX. The inset is the measured beat frequency at various distances at 5 cm intervals. (c) 116 repeated measurements of beat frequency at 100 m.
    (a) Concept of FMCW LIDAR photonic circuit for long-reach detection. (b) and (c) Fourier transform waveform data of the chain antenna OPA and fishbone antenna OPA steering to 0° separately at about 100 m. The signal-to-noise pedestal ratios of the chain antenna OPA and fishbone antenna OPA are 9.15 dB and 13.07 dB. (d) Measured beat frequency at different distances with the fishbone antenna OPA acting as a TX or RX.
    Fig. 8. (a) Concept of FMCW LIDAR photonic circuit for long-reach detection. (b) and (c) Fourier transform waveform data of the chain antenna OPA and fishbone antenna OPA steering to 0° separately at about 100 m. The signal-to-noise pedestal ratios of the chain antenna OPA and fishbone antenna OPA are 9.15 dB and 13.07 dB. (d) Measured beat frequency at different distances with the fishbone antenna OPA acting as a TX or RX.
     Ref. [7]Ref. [12]Ref. [19]Ref. [13]Ref. [14]This Work (Fishbone)This Work (Chain)
    Number of channels641024321288192128128
    Pitch (μm)0.775217.246a129.7a29.7a
    Horizontal steering (°)120459680100100140
    Divergence (°)1.60.032.3×2.80.14×0.140.01×0.0390.021×0.0290.021×0.1
    Aperture (mm)0.04962.0480.032×mb0.927×nb8×54×34×3
    Table 1. Performance Comparison of State-of-the-art OPAs
    Yingzhi Li, Baisong Chen, Quanxin Na, Qijie Xie, Min Tao, Lanxuan Zhang, Zihao Zhi, Yuxuan Li, Xiaobin Liu, Xianshu Luo, Guoqiang Lo, Fengli Gao, Xueyan Li, Junfeng Song. Wide-steering-angle high-resolution optical phased array[J]. Photonics Research, 2021, 9(12): 2511
    Download Citation