• Matter and Radiation at Extremes
  • Vol. 5, Issue 2, 26401 (2020)
D. Klir1、*, S. L. Jackson2, A. V. Shishlov3, V. A. Kokshenev3, K. Rezac1, A. R. Beresnyak2, R. K. Cherdizov3, J. Cikhardt1, B. Cikhardtova1, G. N. Dudkin4, J. T. Engelbrecht2, F. I. Fursov3, J. Krasa5, J. Kravarik1, P. Kubes1, N. E. Kurmaev3, V. Munzar1, N. A. Ratakhin6, K. Turek7, and V. A. Varlachev4
Author Affiliations
  • 1Czech Technical University in Prague, Faculty of Electrical Engineering, 16627 Prague 6, Czech Republic
  • 2Plasma Physics Division, U.S. Naval Research Laboratory, Washington, District of Columbia 20375, USA
  • 3Institute of High Current Electronics SB RAS, Tomsk, 634055, Russia
  • 4National Research Tomsk Polytechnic University, Tomsk, 634050, Russia
  • 5Institute of Physics, Academy of Sciences of Czech Republic, 18221 Prague 8, Czech Republic
  • 6Institute of High Current Electronics SB RAS, Tomsk, 634055, Russia
  • 7Nuclear Physics Institute, Academy of Sciences of Czech Republic, 18086 Prague, Czech Republic
  • show less
    DOI: 10.1063/1.5132845 Cite this Article
    D. Klir, S. L. Jackson, A. V. Shishlov, V. A. Kokshenev, K. Rezac, A. R. Beresnyak, R. K. Cherdizov, J. Cikhardt, B. Cikhardtova, G. N. Dudkin, J. T. Engelbrecht, F. I. Fursov, J. Krasa, J. Kravarik, P. Kubes, N. E. Kurmaev, V. Munzar, N. A. Ratakhin, K. Turek, V. A. Varlachev. Ion acceleration and neutron production in hybrid gas-puff z-pinches on the GIT-12 and HAWK generators[J]. Matter and Radiation at Extremes, 2020, 5(2): 26401 Copy Citation Text show less
    Schematics of experimental setups with hybrid deuterium gas puffs on (a) GIT-12 and (b) HAWK. (c) Time-integrated x-ray pinhole image detected by an unfiltered image plate in HAWK shot 5010.
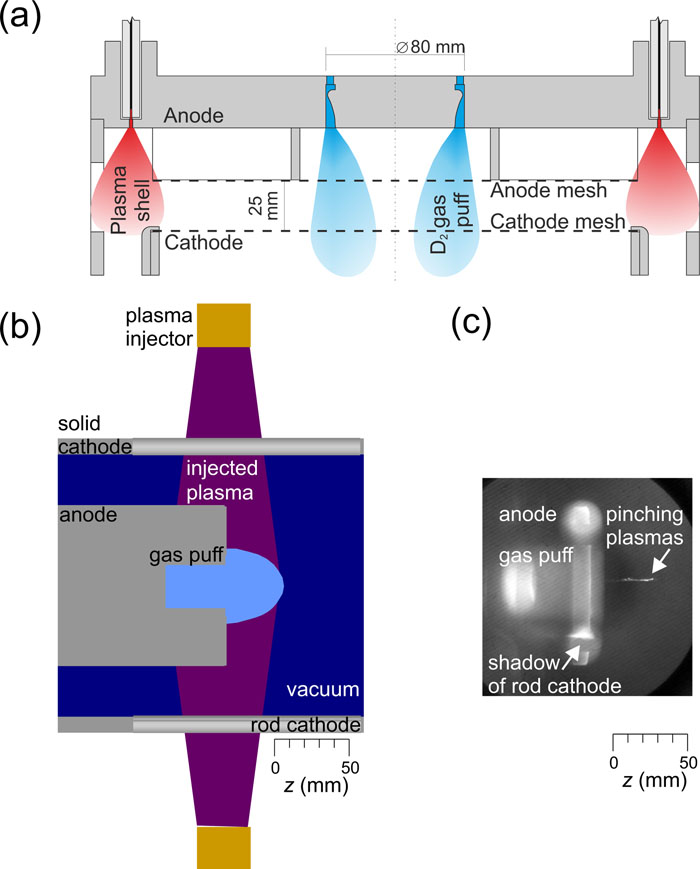
    Fig. 1. Schematics of experimental setups with hybrid deuterium gas puffs on (a) GIT-12 and (b) HAWK. (c) Time-integrated x-ray pinhole image detected by an unfiltered image plate in HAWK shot 5010.
    (a) Current and voltage waveforms and (b) radial neutron ToF signals at 2.00 m and 5.63 m in a hybrid deuterium gas puff z-pinch on GIT-12. Shot 2115, plasma shell on a single-shell D2 gas puff, (2.7 ± 0.5) × 1012 neutrons. (c) Current and voltage waveforms and (d) radial neutron ToF signals at 1.29 m and 3.72 m in a hybrid deuterium gas-puff z-pinch on HAWK. Shot 4999, on-axis D2 gas puff with plasma shell from Marshall guns, (5.0 ± 2.0) × 1010 neutrons. All signals were adjusted to account for different transit times from each detector to the oscilloscopes. The ToF of photons and the electron transit time of the photomultiplier tubes were also included.
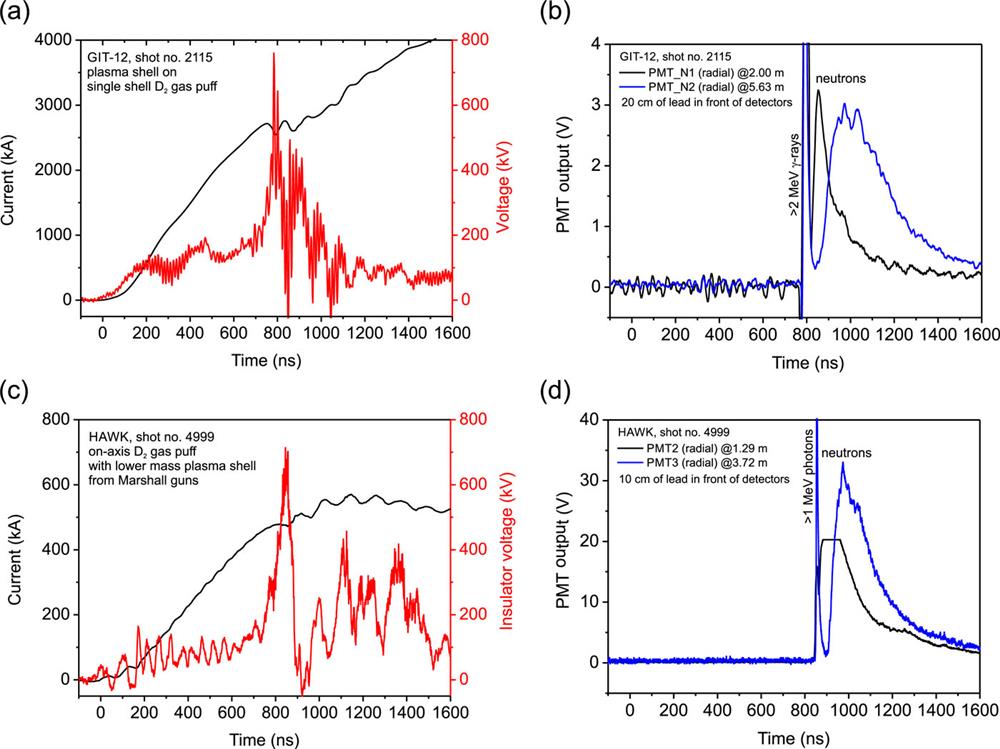
    Fig. 2. (a) Current and voltage waveforms and (b) radial neutron ToF signals at 2.00 m and 5.63 m in a hybrid deuterium gas puff z-pinch on GIT-12. Shot 2115, plasma shell on a single-shell D2 gas puff, (2.7 ± 0.5) × 1012 neutrons. (c) Current and voltage waveforms and (d) radial neutron ToF signals at 1.29 m and 3.72 m in a hybrid deuterium gas-puff z-pinch on HAWK. Shot 4999, on-axis D2 gas puff with plasma shell from Marshall guns, (5.0 ± 2.0) × 1010 neutrons. All signals were adjusted to account for different transit times from each detector to the oscilloscopes. The ToF of photons and the electron transit time of the photomultiplier tubes were also included.
    Measurement of ion-beam profile. (a) Schematic of the axial ion detector on GIT-12. (b) Image of the ion-beam profile on GIT-12 recorded at 10 cm by a CR-39 detector behind a 1 mm aluminum-alloy (EN AW 2017) absorber, three HD-V2 films, 0.1 mm and 0.5 mm Al absorbers, and one 0.49 mm CR-39 detector on shot 1947. (c) Image of the ion-beam profile on HAWK recorded at 20 cm by a CR-39 detector behind a 0.1 mm Al absorber on shot 4983. The detector darkness is proportional to the ion flux.
    Fig. 3. Measurement of ion-beam profile. (a) Schematic of the axial ion detector on GIT-12. (b) Image of the ion-beam profile on GIT-12 recorded at 10 cm by a CR-39 detector behind a 1 mm aluminum-alloy (EN AW 2017) absorber, three HD-V2 films, 0.1 mm and 0.5 mm Al absorbers, and one 0.49 mm CR-39 detector on shot 1947. (c) Image of the ion-beam profile on HAWK recorded at 20 cm by a CR-39 detector behind a 0.1 mm Al absorber on shot 4983. The detector darkness is proportional to the ion flux.
    Measurement of spatial distribution and emission anisotropy of ion sources. (a) Images from a three-pinhole camera on GIT-12 (0.55 magnification and 0.26 mm pinhole diameter) recorded by HD-V2 film behind a 20 µm Al absorber and two HD-V2 films on shot 1947. Spatial scales correspond to the plane of the cathode mesh. (b) Images from the three-pinhole camera on HAWK (0.25 magnification and 0.4 mm pinhole diameter) recorded by the first HD-V2 film behind three different absorbers (6 µm Kimfoil, 10 µm Al, 20 µm Al). Spatial scales correspond to the plane of the anode end.
    Fig. 4. Measurement of spatial distribution and emission anisotropy of ion sources. (a) Images from a three-pinhole camera on GIT-12 (0.55 magnification and 0.26 mm pinhole diameter) recorded by HD-V2 film behind a 20 µm Al absorber and two HD-V2 films on shot 1947. Spatial scales correspond to the plane of the cathode mesh. (b) Images from the three-pinhole camera on HAWK (0.25 magnification and 0.4 mm pinhole diameter) recorded by the first HD-V2 film behind three different absorbers (6 µm Kimfoil, 10 µm Al, 20 µm Al). Spatial scales correspond to the plane of the anode end.
    Measurement of spatial distribution and emission anisotropy of high-energy ion sources. (a) Images from the three-pinhole camera on GIT-12 (0.59 magnification and 0.45 mm pinhole diameter) recorded by EBT-3 film behind 30 µm and 470 µm Al absorbers, seven HD-V2 films, two EBT-3 films, and two 0.58 mm CR-39 detectors on shot 1830. Spatial scales correspond to the plane of the cathode mesh. (b) Images from the three-pinhole camera on HAWK (0.25 magnification and 0.4 mm pinhole diameter) recorded by EBT-3 film behind three different absorbers (6 µm Kimfoil, 10 µm Al, 20 µm Al) and one HD-V2 film. Spatial scales correspond to the plane of the anode end. Note: The EBT-3 films used on HAWK and GIT-12 originated from two different lots.
    Fig. 5. Measurement of spatial distribution and emission anisotropy of high-energy ion sources. (a) Images from the three-pinhole camera on GIT-12 (0.59 magnification and 0.45 mm pinhole diameter) recorded by EBT-3 film behind 30 µm and 470 µm Al absorbers, seven HD-V2 films, two EBT-3 films, and two 0.58 mm CR-39 detectors on shot 1830. Spatial scales correspond to the plane of the cathode mesh. (b) Images from the three-pinhole camera on HAWK (0.25 magnification and 0.4 mm pinhole diameter) recorded by EBT-3 film behind three different absorbers (6 µm Kimfoil, 10 µm Al, 20 µm Al) and one HD-V2 film. Spatial scales correspond to the plane of the anode end. Note: The EBT-3 films used on HAWK and GIT-12 originated from two different lots.
    (a) Time evolution of a post-shot dose rate measured at 0.35 m and 1.00 m on HAWK (black line, shot 5008, 1.4 × 10¹⁰ neutrons) and GIT-12 (red line, shot 2131, 3.8 × 10¹² neutrons). The sampling interval was 10 s. The time of the shots corresponds to t = 0 s. (b) Energy dependence of the 27Al(d,p)28Al reaction cross-section.70 The half-life of the 28Al isotope is 2.25 min.
    Fig. 6. (a) Time evolution of a post-shot dose rate measured at 0.35 m and 1.00 m on HAWK (black line, shot 5008, 1.4 × 10¹⁰ neutrons) and GIT-12 (red line, shot 2131, 3.8 × 10¹² neutrons). The sampling interval was 10 s. The time of the shots corresponds to t = 0 s. (b) Energy dependence of the 27Al(d,p)28Al reaction cross-section.70 The half-life of the 28Al isotope is 2.25 min.
    GeneratorHAWK (NRL)GIT-12 (IHCE)
    Peak current (MA)0.74.0
    Output voltage (MV)0.640.60
    Rise time (μs)1.21.7
    Z-pinch loadPlasma shell on D2 gas puffPlasma shell on D2 gas puff
    Implosion time in optimal regime (μs)0.8–1.00.8
    Typical current at stagnation (MA)0.62.6
    Average neutron yield3 × 10102 × 1012
    Peak neutron yield5 × 10106 × 1012
    Maximum neutron energies, side-on (MeV)1330
    Maximum deuteron energies (MeV) estimated from EBT-3 films in ion pinhole camera835
    Post-shot dose accumulated during 1 h4 µSv at 0.3 m35 µSv at 1 m
    Table 1. Comparison of HAWK and GIT-12 experiments through 2018.
    D. Klir, S. L. Jackson, A. V. Shishlov, V. A. Kokshenev, K. Rezac, A. R. Beresnyak, R. K. Cherdizov, J. Cikhardt, B. Cikhardtova, G. N. Dudkin, J. T. Engelbrecht, F. I. Fursov, J. Krasa, J. Kravarik, P. Kubes, N. E. Kurmaev, V. Munzar, N. A. Ratakhin, K. Turek, V. A. Varlachev. Ion acceleration and neutron production in hybrid gas-puff z-pinches on the GIT-12 and HAWK generators[J]. Matter and Radiation at Extremes, 2020, 5(2): 26401
    Download Citation