• Acta Optica Sinica
  • Vol. 43, Issue 21, 2106004 (2023)
Chenglei Fan1, Binbin Luo1、*, Decao Wu1, Xue Zou1、2, Hongcheng Rao1, Fumin Zhou1, Ling Huang1, Shenghui Shi1, and Xinyu Hu1
Author Affiliations
  • 1Chongqing Key Laboratory of Optical Fiber Sensor and Photoelectric Detection, Chongqing University of Technology, Chongqing 400054, China
  • 2School of Communications and Information Engineering, Chongqing University of Posts and Telecommunications, Chongqing 400065, China
  • show less
    DOI: 10.3788/AOS231313 Cite this Article Set citation alerts
    Chenglei Fan, Binbin Luo, Decao Wu, Xue Zou, Hongcheng Rao, Fumin Zhou, Ling Huang, Shenghui Shi, Xinyu Hu. Flexible Bionic Microstructure Tactile Sensor Based on Micro-Nano Optical Fiber[J]. Acta Optica Sinica, 2023, 43(21): 2106004 Copy Citation Text show less
    Schematic diagram of a FIMF sensor simulating human finger skin. (a) Structure of fingertip skin; (b) structure of FIMF sensor
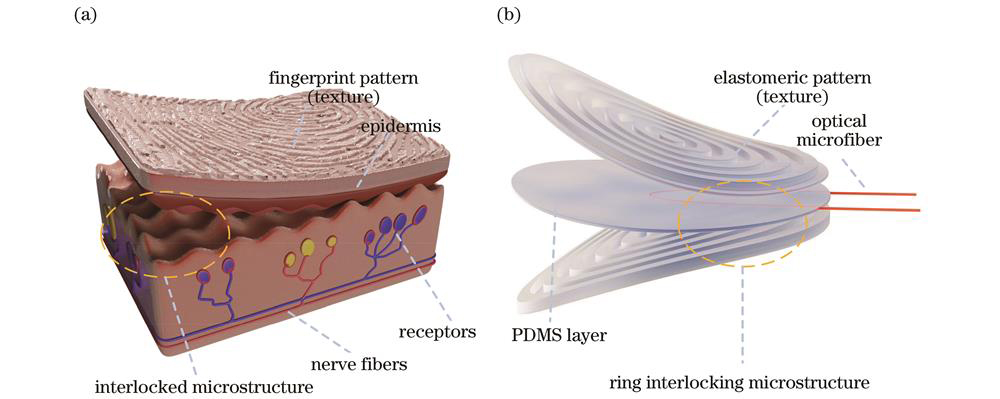
    Fig. 1. Schematic diagram of a FIMF sensor simulating human finger skin. (a) Structure of fingertip skin; (b) structure of FIMF sensor
    Effect of sensor layer thickness on performance. (a) Effect of PDMS thickness on stress; (b) effect of annular ridge thickness on stress
    Fig. 2. Effect of sensor layer thickness on performance. (a) Effect of PDMS thickness on stress; (b) effect of annular ridge thickness on stress
    Sensor mechanical response. (a) Planar deformation distribution where the optical fiber is located; (b) stress distribution under different conditions; (c) sensor output response under finger press sliding
    Fig. 3. Sensor mechanical response. (a) Planar deformation distribution where the optical fiber is located; (b) stress distribution under different conditions; (c) sensor output response under finger press sliding
    Schematic diagram of the structure of dual-mode interference MNF
    Fig. 4. Schematic diagram of the structure of dual-mode interference MNF
    Micro-nano fiber. (a) Change of effective refractive index and MNF diameter of HE11 and HE12 modes when the wavelength is 1550 nm; (b) MNF analog spectra with diameters of 10 μm, 5 μm, and 2.3 μm; (c) changes in FSR around 1550 nm for different diameters of MNF
    Fig. 5. Micro-nano fiber. (a) Change of effective refractive index and MNF diameter of HE11 and HE12 modes when the wavelength is 1550 nm; (b) MNF analog spectra with diameters of 10 μm, 5 μm, and 2.3 μm; (c) changes in FSR around 1550 nm for different diameters of MNF
    Physical diagram of the sensor. (a) Microscope diagram of MNF with a diameter of 5 μm; (b) physical drawing of FIMF;(c) transmission spectra before and after packaging
    Fig. 6. Physical diagram of the sensor. (a) Microscope diagram of MNF with a diameter of 5 μm; (b) physical drawing of FIMF;(c) transmission spectra before and after packaging
    Comparison and calibration of mechanical properties. (a) Diagram of the experimental system for mechanical property testing; (b) comparison of sensors with different structural packages; (c) FIMF pressure spectral response; (d) FIMF sensitivity; (e) repeatability; (f) response/recovery time
    Fig. 7. Comparison and calibration of mechanical properties. (a) Diagram of the experimental system for mechanical property testing; (b) comparison of sensors with different structural packages; (c) FIMF pressure spectral response; (d) FIMF sensitivity; (e) repeatability; (f) response/recovery time
    Mechanical property tests. (a) Response curve for incremental pressure; (b) repeatability testing; (c) sensor response of different frequencies at 1 N pressure; (d) different pressure sensors response at 0.5 Hz
    Fig. 8. Mechanical property tests. (a) Response curve for incremental pressure; (b) repeatability testing; (c) sensor response of different frequencies at 1 N pressure; (d) different pressure sensors response at 0.5 Hz
    Hardness perception. (a) Diagram of the experimental system; (b) relationship between the change in the transmission strength and hardness of the three cycles ; (c) relationship between the change in strength and the change in hardness of a single cycle; (d) relationship between hardness and transmission strength of 30 cycles; (e) FIMF integration into the manipulator; (f) waveforms of intensity changes when gripping different objects using a robotic hand integrated with FIMF
    Fig. 9. Hardness perception. (a) Diagram of the experimental system; (b) relationship between the change in the transmission strength and hardness of the three cycles ; (c) relationship between the change in strength and the change in hardness of a single cycle; (d) relationship between hardness and transmission strength of 30 cycles; (e) FIMF integration into the manipulator; (f) waveforms of intensity changes when gripping different objects using a robotic hand integrated with FIMF
    Texture perception. (a) Schematic diagram of the experimental system; (b) test objects with a spacing of 4 mm; (c) response waveform of the contact scan; (d) response waveforms scanned at different pressures; (e) response waveform at 50 mm/s and 100 mm/s scanning speed
    Fig. 10. Texture perception. (a) Schematic diagram of the experimental system; (b) test objects with a spacing of 4 mm; (c) response waveform of the contact scan; (d) response waveforms scanned at different pressures; (e) response waveform at 50 mm/s and 100 mm/s scanning speed
    Different scanning speeds. (a) Response waveform; (b) spectrograms of FFT transforms; (c) time-frequency diagram of FFT transform
    Fig. 11. Different scanning speeds. (a) Response waveform; (b) spectrograms of FFT transforms; (c) time-frequency diagram of FFT transform
    Test objects with different textures. (a) Physical drawings of test objects with texture spacing of 1 mm and 0.5 mm; (b) response waveform; (c) time-frequency diagram of FFT transform
    Fig. 12. Test objects with different textures. (a) Physical drawings of test objects with texture spacing of 1 mm and 0.5 mm; (b) response waveform; (c) time-frequency diagram of FFT transform
    Package materialMicro structureHighest sensitivityWorking rangeFiber diameterResponse timeRef.
    PDMSNone1870 kPa-10-3 N0.5 µm20 µs15
    PDMS/resinParallel ring5.4 %N-10-20 N1.2 µm17
    PDMS/resinInterlocking20.58 %N-10-16 N5 µm86 msProposed
    Table 1. Performance comparison with other micro-nano fiber tactile pressure sensors
    Chenglei Fan, Binbin Luo, Decao Wu, Xue Zou, Hongcheng Rao, Fumin Zhou, Ling Huang, Shenghui Shi, Xinyu Hu. Flexible Bionic Microstructure Tactile Sensor Based on Micro-Nano Optical Fiber[J]. Acta Optica Sinica, 2023, 43(21): 2106004
    Download Citation