• Spectroscopy and Spectral Analysis
  • Vol. 41, Issue 1, 229 (2021)
Xu ZHANG1、1, Tian-gang ZHANG1、1, Wei-song MU1、1, Ze-tian FU1、1, and Xiao-shuan ZHANG1、1
Author Affiliations
  • 1[in Chinese]
  • 11. College of Information and Electrical Engineering, China Agricultural University, Beijing 100083, China
  • show less
    DOI: 10.3964/j.issn.1000-0593(2021)01-0229-07 Cite this Article
    Xu ZHANG, Tian-gang ZHANG, Wei-song MU, Ze-tian FU, Xiao-shuan ZHANG. Prediction of Soluble Solids Content for Wine Grapes During Maturing Based on Visible and Near-Infrared Spectroscopy[J]. Spectroscopy and Spectral Analysis, 2021, 41(1): 229 Copy Citation Text show less
    Sampling sites of wine grape
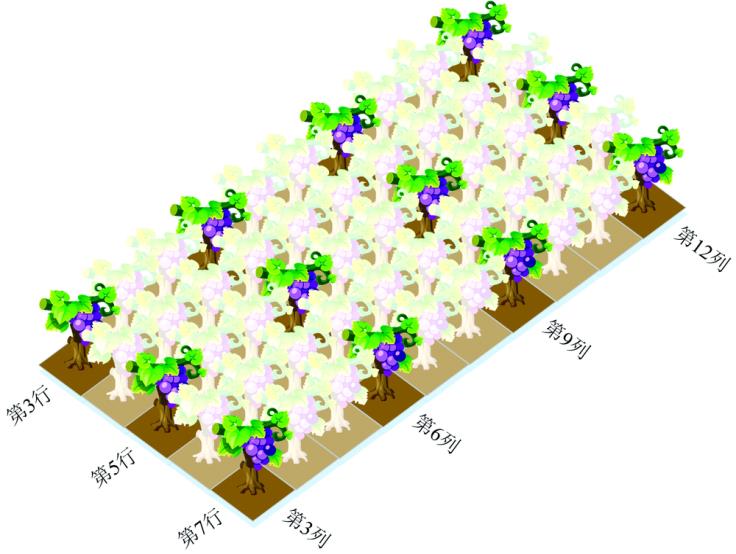
    Fig. 1. Sampling sites of wine grape
    The absorbance spectra of grape berries
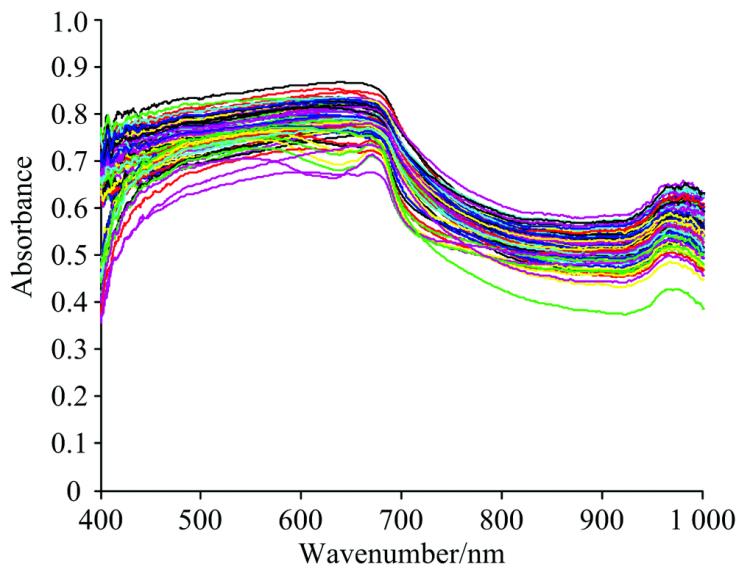
    Fig. 2. The absorbance spectra of grape berries
    The absorbance spectra of canopy leaves of grape
    Fig. 3. The absorbance spectra of canopy leaves of grape
    PCA score plot of Chardonnay grape
    Fig. 4. PCA score plot of Chardonnay grape
    Results of calibration and validation of SSC prediction model for Chardonnay grape
    Fig. 5. Results of calibration and validation of SSC prediction model for Chardonnay grape
    Results of calibration and validation of SSC prediction model for Petit Manseng grape
    Fig. 6. Results of calibration and validation of SSC prediction model for Petit Manseng grape
    Results of calibration and validation of SSC prediction model for Merlot grape
    Fig. 7. Results of calibration and validation of SSC prediction model for Merlot grape
    Results of calibration and validation of SSC prediction model for Cabernet Sauvignon grape
    Fig. 8. Results of calibration and validation of SSC prediction model for Cabernet Sauvignon grape
    Results of calibration and validation of SSC prediction model for Cabernet Franc grape
    Fig. 9. Results of calibration and validation of SSC prediction model for Cabernet Franc grape
    Results of calibration and validation of SSC prediction model for Chardonnay leaves
    Fig. 10. Results of calibration and validation of SSC prediction model for Chardonnay leaves
    Results of calibration and validation of SSC prediction model for Petit Manseng leaves
    Fig. 11. Results of calibration and validation of SSC prediction model for Petit Manseng leaves
    Results of calibration and validation of SSC prediction model for Merlot leaves
    Fig. 12. Results of calibration and validation of SSC prediction model for Merlot leaves
    Results of calibration and validation of SSC prediction model for Cabernet Sauvignon leaves
    Fig. 13. Results of calibration and validation of SSC prediction model for Cabernet Sauvignon leaves
    Results of calibration and validation of SSC prediction model for Cabernet Franc leaves
    Fig. 14. Results of calibration and validation of SSC prediction model for Cabernet Franc leaves
    样品
    名称
    类别样品
    子集
    样本
    数量
    范围/%均值
    /%
    标准误
    差/%
    霞多丽浆果校正集6417.0~22.919.760.78
    验证集2118.4~20.819.720.66
    小芒森浆果校正集6419.9~23.421.670.72
    验证集2020.5~22.621.550.63
    梅洛浆果校正集6617.0~22.920.221.03
    验证集2218.3~22.220.501.00
    赤霞珠浆果校正集6019.1~20.920.170.46
    验证集2018.8~21.320.050.64
    品丽珠浆果校正集6617.2~21.319.670.80
    验证集2218.0~21.219.530.78
    霞多丽叶片校正集5018.0~21.419.540.72
    验证集1618.5~21.319.710.56
    小芒森叶片校正集5019.9~23.621.871.03
    验证集1720.8~23.021.810.56
    梅洛叶片校正集5317.2~23.720.471.54
    验证集1619.5~22.820.560.91
    赤霞珠叶片校正集4918.1~23.220.121.03
    验证集1518.6~21.419.830.79
    品丽珠叶片校正集5318.1~21.219.610.73
    验证集1718.8~20.719.850.55
    Table 1. Statistics results of SSC of sample sets
    样品
    种类
    预处理方法PCS校正集验证集
    RCRMSECRVRMSEV
    霞多丽S-G20.720.760.730.64
    S-G+FD20.780.490.830.40
    S-G+SNV+FD20.830.440.850.36
    S-G+MSC+FD30.930.300.860.36
    小芒森S-G40.610.580.410.63
    S-G+FD30.950.220.860.33
    S-G+SNV+FD30.950.220.860.33
    S-G+MSC+FD30.950.220.860.30
    梅洛S-G70.730.700.760.70
    S-G+FD71.000.090.830.54
    S-G+SNV+FD40.960.300.880.48
    S-G+MSC+FD50.960.290.880.48
    赤霞珠S-G40.910.190.870.35
    S-G+FD10.930.180.850.37
    S-G+SNV+FD20.970.120.880.31
    S-G+MSC+FD70.980.020.820.40
    品丽珠S-G60.710.560.670.33
    S-G+FD30.810.370.710.66
    S-G+SNV+FD40.930.270.810.37
    S-G+MSC+FD40.960.220.860.44
    Table 2. Comparison of PLS prediction models with four different pretreatment methods
    样品
    种类
    预处理方法PCS校正集验证集
    RCRMSECRVRMSEV
    霞多丽S-G10.690.650.360.79
    S-G+FD10.700.520.550.68
    S-G+SNV+FD10.710.660.610.55
    S-G+MSC+FD10.760.460.670.44
    小芒森S-G20.610.960.410.75
    S-G+FD30.660.830.590.70
    S-G+SNV+FD20.750.790.600.58
    S-G+MSC+FD20.800.610.660.48
    梅洛S-G10.620.700.520.97
    S-G+FD20.720.690.610.86
    S-G+SNV+FD20.720.900.610.80
    S-G+MSC+FD20.780.960.660.75
    赤霞珠S-G10.471.260.511.27
    S-G+FD20.610.990.610.99
    S-G+SNV+FD10.700.860.620.77
    S-G+MSC+FD10.730.710.690.70
    品丽珠S-G30.600.900.411.65
    S-G+FD20.690.770.590.99
    S-G+SNV+FD20.710.590.600.75
    S-G+MSC+FD20.780.460.650.44
    Table 3. Comparison of PLS prediction models with four different pretreatment methods
    样品
    名称
    样品
    类别
    数量范围/%绝对误
    差/%
    相对误
    差/%
    霞多丽浆果2018.4~20.80.08-0.44
    小芒森浆果2020.5~22.6-0.02-0.06
    梅洛浆果2019.1~22.2-0.09-0.35
    赤霞珠浆果2018.8~20.9-0.01-0.05
    品丽珠浆果2018.0~21.20.070.43
    Table 4. External validation results of samples of berry and canopy leaves
    Xu ZHANG, Tian-gang ZHANG, Wei-song MU, Ze-tian FU, Xiao-shuan ZHANG. Prediction of Soluble Solids Content for Wine Grapes During Maturing Based on Visible and Near-Infrared Spectroscopy[J]. Spectroscopy and Spectral Analysis, 2021, 41(1): 229
    Download Citation