• Laser & Optoelectronics Progress
  • Vol. 58, Issue 9, 0905002 (2021)
Gongli Xiao1, Yuting Yang1, Hongyan Yang2、3、*, Kaifu Zhang1, Lizhen Zeng4, Haiou Li1, Xingpeng Liu1, and Tao Fu1
Author Affiliations
  • 1Guangxi Key Laboratory of Precision Navigation Technology and Application, Guilin University of Electronic Technology, Guilin , Guangxi 541004, China
  • 2Guangxi Key Laboratory of Automatic Detecting Technology and Instruments, Guilin University of Electronic Technology, Guilin , Guangxi 541004, China
  • 3School of Electronic Engineering and Automation, Guilin University of Electronic Technology, Guilin , Guangxi 541004, China
  • 4Graduate School, Guilin University of Electronic Technology, Guilin , Guangxi 541004, China
  • show less
    DOI: 10.3788/LOP202158.0905002 Cite this Article Set citation alerts
    Gongli Xiao, Yuting Yang, Hongyan Yang, Kaifu Zhang, Lizhen Zeng, Haiou Li, Xingpeng Liu, Tao Fu. Plasmonic Color Filter Based on Rectangular Metal Block Array Structure[J]. Laser & Optoelectronics Progress, 2021, 58(9): 0905002 Copy Citation Text show less
    Color filter based on rectangular metal block array structure, and its dispersion relationship and transmission spectra. (a) Three-dimensional structural diagram; (b) dispersion curve of TM/TE waveguide mode for asymmetric waveguide film composed of MgF2, Si3N4, and air; (c) transmission spectra for conditions: Px=300 nm, Py=400 nm; Px=400 nm, Py=500 nm; Px=500 nm, Py=350 nm
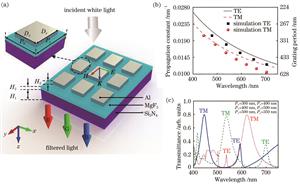
    Fig. 1. Color filter based on rectangular metal block array structure, and its dispersion relationship and transmission spectra. (a) Three-dimensional structural diagram; (b) dispersion curve of TM/TE waveguide mode for asymmetric waveguide film composed of MgF2, Si3N4, and air; (c) transmission spectra for conditions: Px=300 nm, Py=400 nm; Px=400 nm, Py=500 nm; Px=500 nm, Py=350 nm
    Effects of color filter structural parameters H1, H2, H3, fx, and fy on transmission spectra for TM polarization state, Px=400 nm, and Py=300 nm. (a) H1 is 60‒140 nm; (b) H2 is 0‒50 nm; (c) H3 is 20‒60 nm; (d) when fy=0.7, fx is 0.5‒0.9; (e) when fx=0.7, fy is 0.5‒0.9
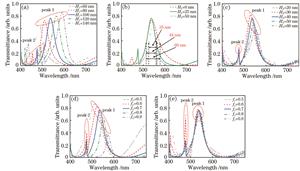
    Fig. 2. Effects of color filter structural parameters H1, H2, H3, fx, and fy on transmission spectra for TM polarization state, Px=400 nm, and Py=300 nm. (a) H1 is 60‒140 nm; (b) H2 is 0‒50 nm; (c) H3 is 20‒60 nm; (d) when fy=0.7, fx is 0.5‒0.9; (e) when fx=0.7, fy is 0.5‒0.9
    Influence of φ on transmission spectrum and its chromaticity coordinate diagram of color filter for Px≠Py. (a) Transmission spectrum under different φ for Px=300 nm and Py=400 nm; (b) CIE1931 chromaticity diagram corresponding to Fig. 3(a); (c) transmission spectrum under different φ for Px=300 nm and Py=500 nm; (d) CIE1931 chromaticity diagram corresponding to Fig. 3(c); (e) transmission spectrum under different φ for Px=300 nm and Py=600 nm; (f) CIE1931 chromaticity diagram corresponding to Fig. 3(e)
    Fig. 3. Influence of φ on transmission spectrum and its chromaticity coordinate diagram of color filter for PxPy. (a) Transmission spectrum under different φ for Px=300 nm and Py=400 nm; (b) CIE1931 chromaticity diagram corresponding to Fig. 3(a); (c) transmission spectrum under different φ for Px=300 nm and Py=500 nm; (d) CIE1931 chromaticity diagram corresponding to Fig. 3(c); (e) transmission spectrum under different φ for Px=300 nm and Py=600 nm; (f) CIE1931 chromaticity diagram corresponding to Fig. 3(e)
    Influence of φ on electric field distribution of rectangular metal block in x-y plane when Px≠Py. (a)‒(c) Px=300 nm, Py=400 nm; (d)‒(f) Px=300 nm, Py=500 nm; (g)‒(i) Px=300 nm, Py=600 nm
    Fig. 4. Influence of φ on electric field distribution of rectangular metal block in x-y plane when PxPy. (a)‒(c) Px=300 nm, Py=400 nm; (d)‒(f) Px=300 nm, Py=500 nm; (g)‒(i) Px=300 nm, Py=600 nm
    Influence of Py on transmission spectrum and its chromaticity coordinate diagram of color filter when Px and φ are fixed. (a) Transmission spectra for Px=300 nm and φ=0° when Py is 300‒600 nm; (b) CIE1931 chromaticity diagram corresponding to Fig. 5(a); (c) transmission spectra for Px=500 nm and φ=0° when Py is 300‒600 nm; (d) CIE1931 chromaticity diagram corresponding to Fig. 5(c)
    Fig. 5. Influence of Py on transmission spectrum and its chromaticity coordinate diagram of color filter when Px and φ are fixed. (a) Transmission spectra for Px=300 nm and φ=0° when Py is 300‒600 nm; (b) CIE1931 chromaticity diagram corresponding to Fig. 5(a); (c) transmission spectra for Px=500 nm and φ=0° when Py is 300‒600 nm; (d) CIE1931 chromaticity diagram corresponding to Fig. 5(c)
    All-optical control achieved by three different sizes of filters with rectangular metal block array structure. (a) Transmission spectra under different polarization angles (Ⅰ: Px=300 nm, Py=400 nm; Ⅱ: Px=400 nm, Py=500 nm; Ⅲ:Px=500 nm, Py=300 nm); (b) three-dimentional structures of filters with different sizes corresponding to Fig. 6(a); (c) CIE1931 chromaticity diagram corresponding to Fig. 6(a)
    Fig. 6. All-optical control achieved by three different sizes of filters with rectangular metal block array structure. (a) Transmission spectra under different polarization angles (Ⅰ: Px=300 nm, Py=400 nm; Ⅱ: Px=400 nm, Py=500 nm; Ⅲ:Px=500 nm, Py=300 nm); (b) three-dimentional structures of filters with different sizes corresponding to Fig. 6(a); (c) CIE1931 chromaticity diagram corresponding to Fig. 6(a)
    Gongli Xiao, Yuting Yang, Hongyan Yang, Kaifu Zhang, Lizhen Zeng, Haiou Li, Xingpeng Liu, Tao Fu. Plasmonic Color Filter Based on Rectangular Metal Block Array Structure[J]. Laser & Optoelectronics Progress, 2021, 58(9): 0905002
    Download Citation