
Mengcong Du, Qianqian Liu, Lang Marion, Xiuhong Wang, Pu Wang. Research Progress and Application of Cell Lasers[J]. Laser & Optoelectronics Progress, 2018, 55(12): 120001
- Laser & Optoelectronics Progress
- Vol. 55, Issue 12, 120001 (2018)
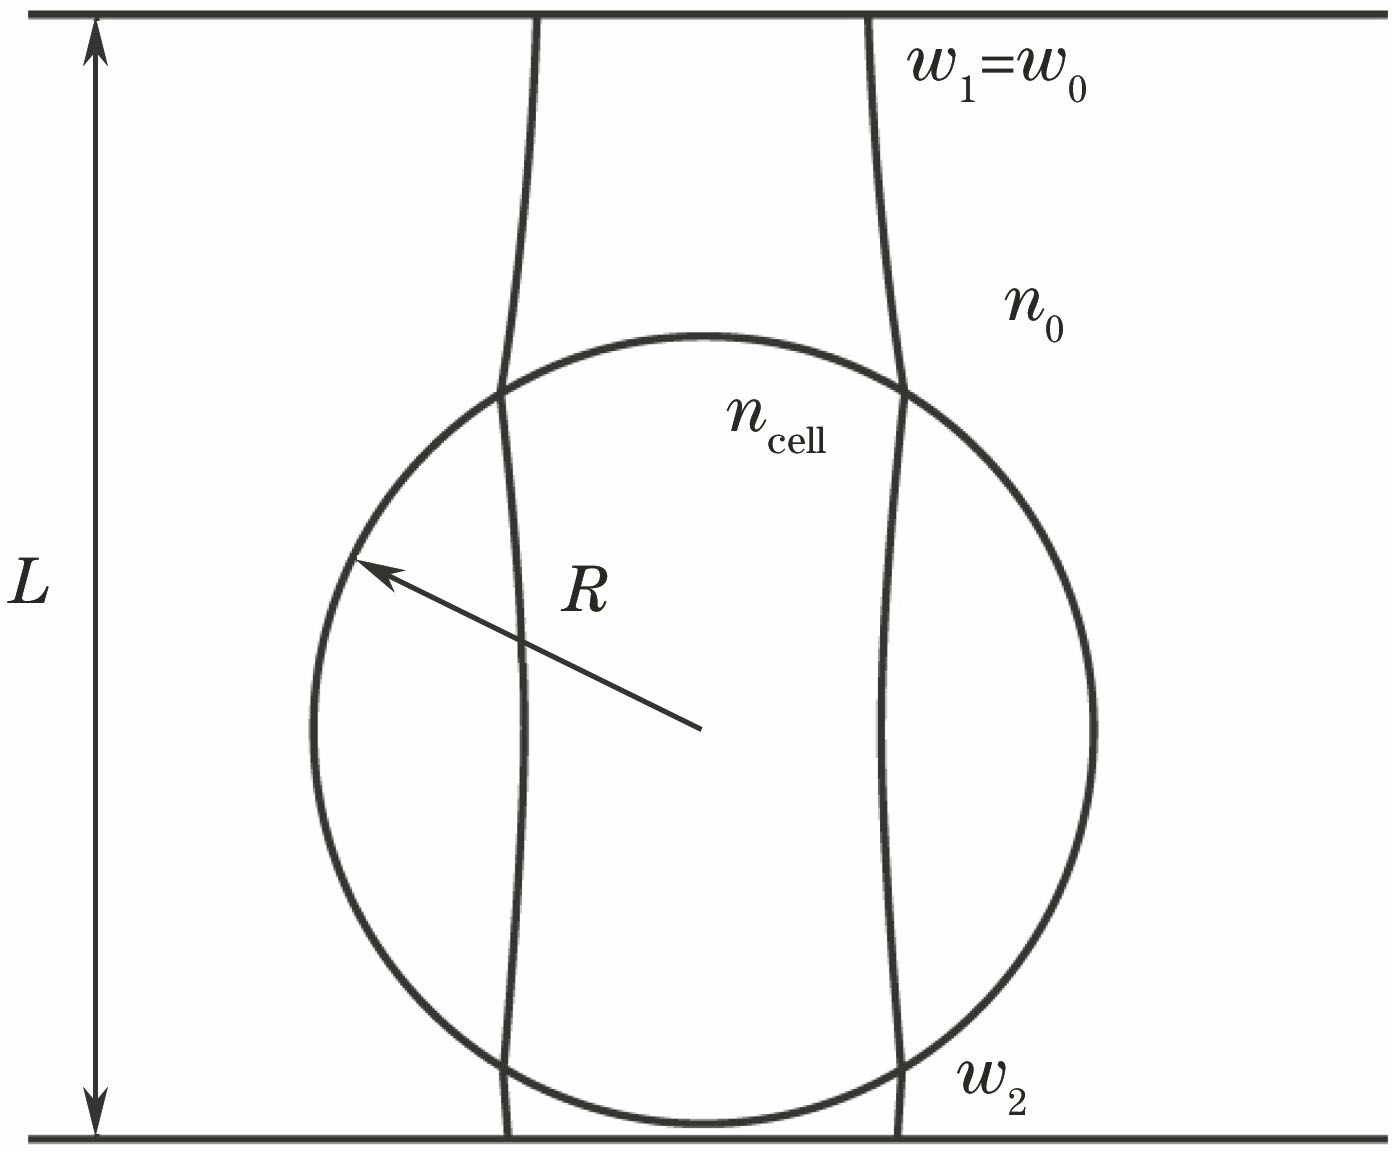
Fig. 1. Schematic of cell lasers based on Fabry-Perot cavity
![Emission and absorption spectra of GFP[17]](/richHtml/lop/2018/55/12/120001/img_2.jpg)
Fig. 2. Emission and absorption spectra of GFP[17]
Fig. 3. Emission spectra at different pump wavelengths[17]
Fig. 4. Installation diagram of single cell lasers[17]
Fig. 5. Laser output energy as a function of pump energy[17]
Fig. 6. Output spectra for pump energies of 0.9 nJ (a) and 5 nJ (b), respectively[17]
Fig. 7. Schematic of whispering gallery mode
Fig. 8. Injected oil droplet cell lasers[57]
Fig. 9. Output spectrum of injected oil droplet lasers[57]
Fig. 10. Confocal image of an adipocyte containing a large lipid droplet (orange)[57]
Fig. 11. Physical device diagram of porcine skin cell laser[57]
Fig. 12. Output spectrum of adipocyte[57]
Fig. 13. Three types of microsphere resonators and their output spectra[57]. (a) Gain in microspheres; (b) gain outside microspheres; (c) gain on the surface of microspheres
Fig. 14. Comparison of fluorescence-based detection and laser-based detection[58]. (a) Fluorescence signal; (b) laser-based signal
Fig. 15. BaTio3 microsphere during HeLa cell division[59]. (a) Bright-field images of microspheres in cells; (b) measured spectral shifts of mitosis progress
Fig. 16. Polystyrene microsphere images and corresponding emission spectra of 3T3 cell division process[60]. Mother cells are denoted as A (red) and subsequent daughter generations are labeled with B (blue), C (violet) and D (orange), respectively
Fig. 17. Living cell biological analysis device[58]
Fig. 18. Corresponding diameters of hyperspectral image of microspheres[57]
Fig. 19. Emission spectra of each cell at 0, 7, 19 h and bright-field images of each cell at 0 h[60]
Fig. 20. Schematic of the microfluidic chip setup[61]
Fig. 21. Spectrum barcod after data processing[61]
Fig. 22. Schematic of cell lasers for imaging source[58]
Fig. 23. Micro-laser source for implantable biological tissue[69]. (a) Implant in the bovine cornea; (b) implant in the blood; (c) implant in the skin tissue

Set citation alerts for the article
Please enter your email address
© Copyright 2018-2021 | Chinese Laser Press. All Rights Reserved 沪ICP备15018463号-20