• Photonics Research
  • Vol. 7, Issue 7, 783 (2019)
Ashik A. S.1、*, Callum F. O’Donnell2、3, S. Chaitanya Kumar2、3, M. Ebrahim-Zadeh2、3、4, P. Tidemand-Lichtenberg1, and C. Pedersen1
Author Affiliations
  • 1DTU Fotonik, Technical University of Denmark, DK-4000 Roskilde, Denmark
  • 2Radiantis, Edifici RDIT, Mediterranean Technology Park, 08860 Castelldefels, Barcelona, Spain
  • 3ICFO-Institut de Ciències Fotòniques, Barcelona Institute of Science and Technology, 08860 Castelldefels, Barcelona, Spain
  • 4Institució Catalana de Recerca i Estudis Avançats (ICREA), Passeig Lluís Companys 23, 08010 Barcelona, Spain
  • show less
    DOI: 10.1364/PRJ.7.000783 Cite this Article Set citation alerts
    Ashik A. S., Callum F. O’Donnell, S. Chaitanya Kumar, M. Ebrahim-Zadeh, P. Tidemand-Lichtenberg, C. Pedersen. Mid-infrared upconversion imaging using femtosecond pulses[J]. Photonics Research, 2019, 7(7): 783 Copy Citation Text show less
    Schematic of the experimental setup used for mid-IR femtosecond upconversion imaging. HWP, half-wave plate; PBS, polarizing beam splitter; OPO, optical parametric oscillator; BC, beam combiner; LN, lithium niobate crystal; MgO:PPLN, magnesium oxide-doped periodically poled LN crystal; f, lenses.
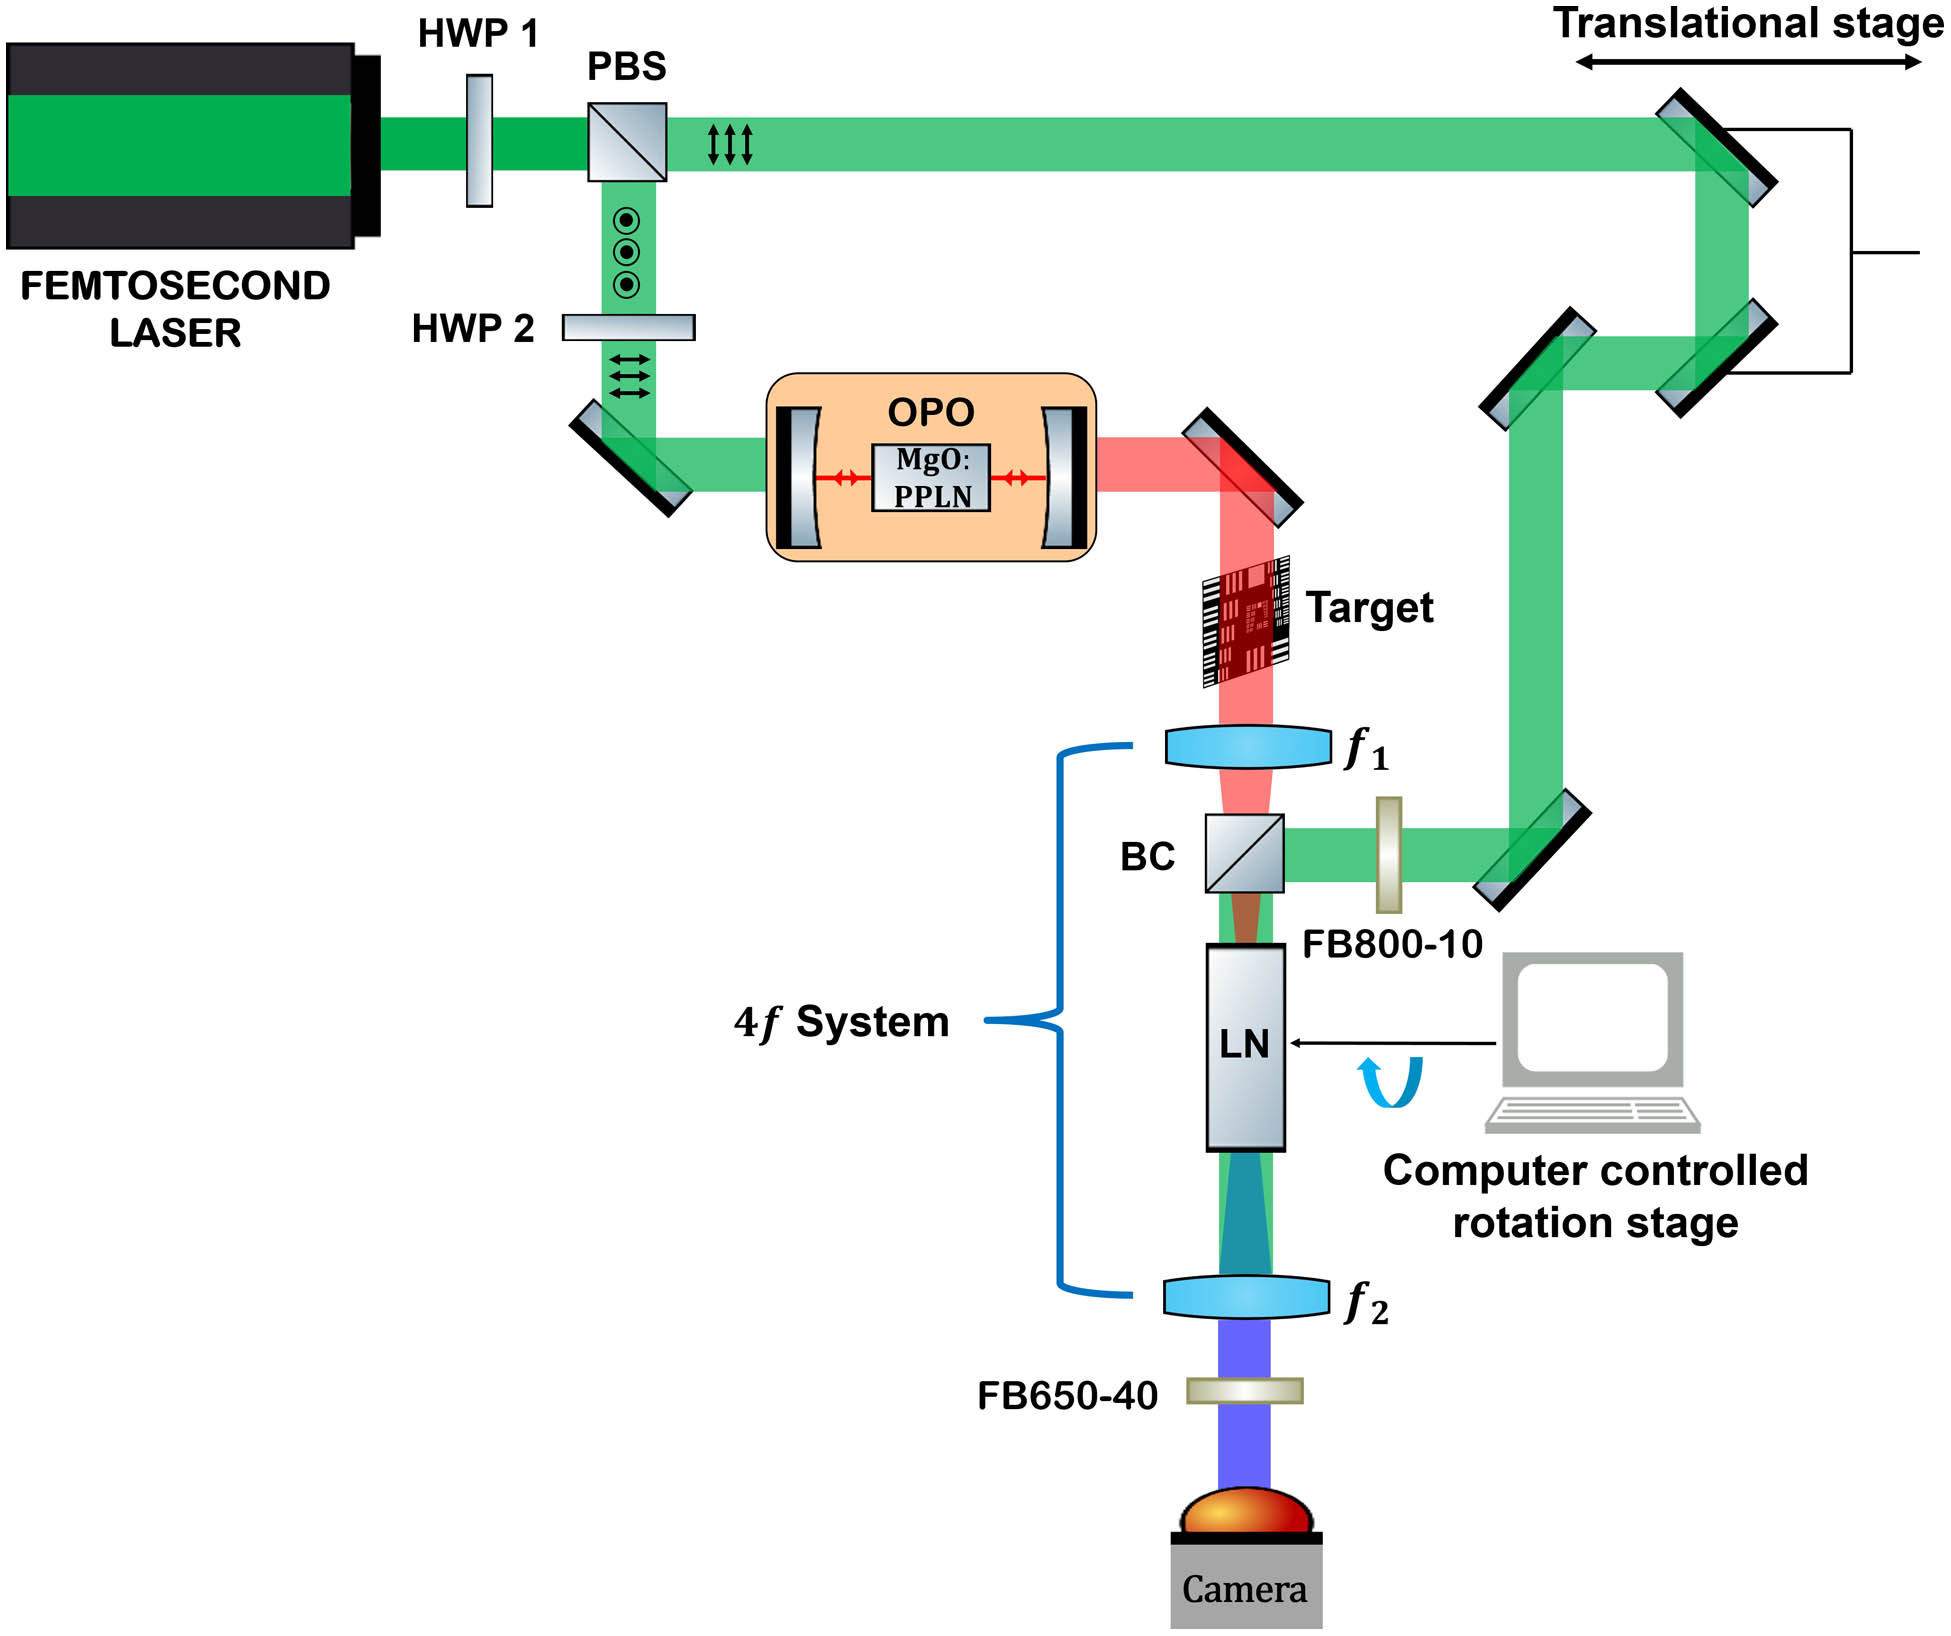
    Fig. 1. Schematic of the experimental setup used for mid-IR femtosecond upconversion imaging. HWP, half-wave plate; PBS, polarizing beam splitter; OPO, optical parametric oscillator; BC, beam combiner; LN, lithium niobate crystal; MgO:PPLN, magnesium oxide-doped periodically poled LN crystal; f, lenses.
    Illustration of various angles used in the calculations. Description of different lines used is included in the figure. c^ represents the optic axis of the crystal, θir is the angle between the mid-IR field and the pump field, θup is the angle between the upconverted field and the pump field, θcut is the cutting angle of the crystal with respect to the c^ axis, ρc is the external crystal rotation angle with respect to the pump field, and ϕ is the angle between the extraordinary upconverted field and the c^ axis. The pump field direction is considered to be fixed.
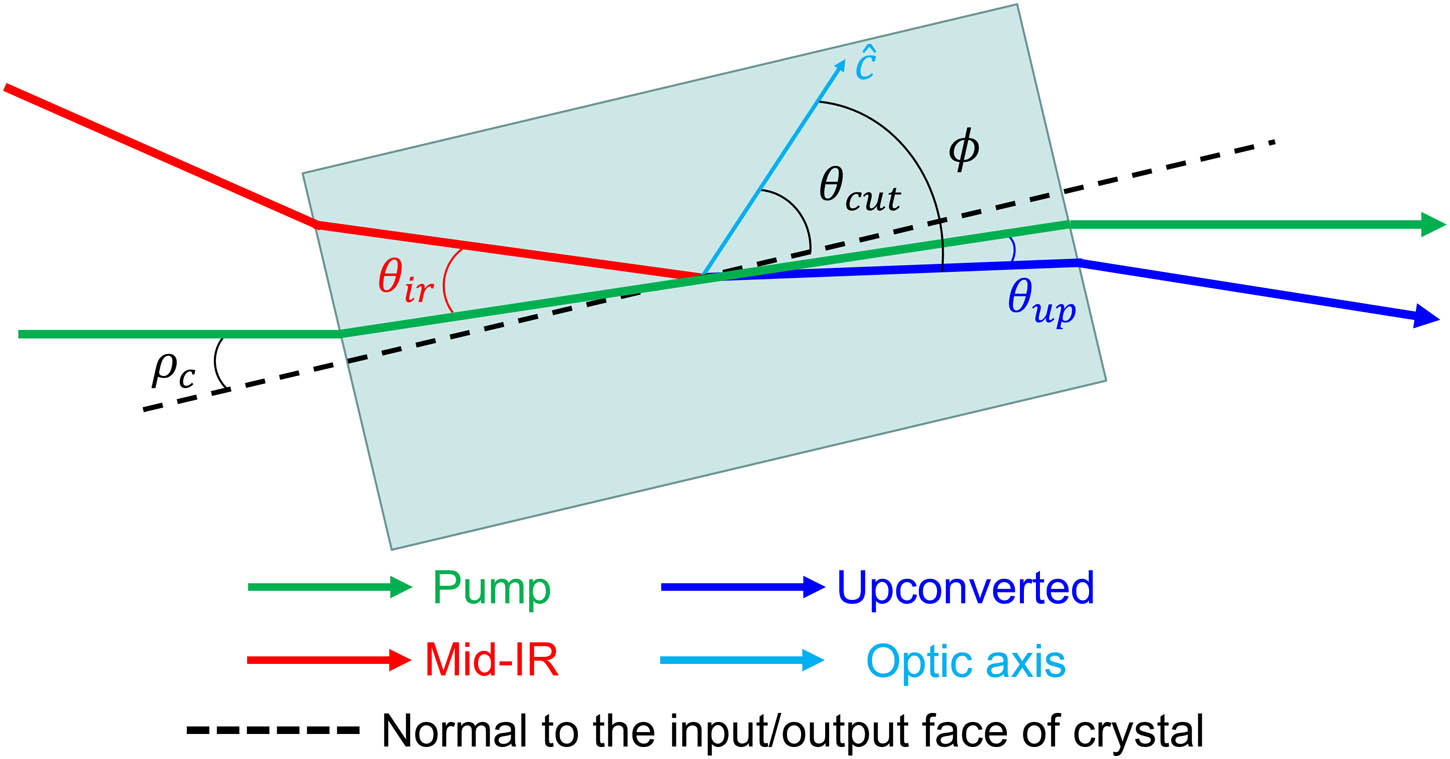
    Fig. 2. Illustration of various angles used in the calculations. Description of different lines used is included in the figure. c^ represents the optic axis of the crystal, θir is the angle between the mid-IR field and the pump field, θup is the angle between the upconverted field and the pump field, θcut is the cutting angle of the crystal with respect to the c^ axis, ρc is the external crystal rotation angle with respect to the pump field, and ϕ is the angle between the extraordinary upconverted field and the c^ axis. The pump field direction is considered to be fixed.
    Calculation of I(ρc). (a) shows the contribution to I(ρc) from different mid-IR input angles; (b) shows the contribution to I(ρc) from all mid-IR angles and wavelengths; (c) shows the contribution to I(ρc) from all mid-IR angles and all mid-IR and pump wavelengths. The spectral weighing is applied at all mid-IR and pump wavelengths, respectively, in (b) and (c). The peak of intensity at each wavelength traces a Gaussian profile. (d) shows the final upconverted intensity I(ρc) for the three experimental central mid-IR wavelengths.
    Fig. 3. Calculation of I(ρc). (a) shows the contribution to I(ρc) from different mid-IR input angles; (b) shows the contribution to I(ρc) from all mid-IR angles and wavelengths; (c) shows the contribution to I(ρc) from all mid-IR angles and all mid-IR and pump wavelengths. The spectral weighing is applied at all mid-IR and pump wavelengths, respectively, in (b) and (c). The peak of intensity at each wavelength traces a Gaussian profile. (d) shows the final upconverted intensity I(ρc) for the three experimental central mid-IR wavelengths.
    Comparison of experimental and theoretical values of Δρc for the three different mid-IR wavelengths.
    Fig. 4. Comparison of experimental and theoretical values of Δρc for the three different mid-IR wavelengths.
    Illustration of upconverted intensity as a function of (a) mid-IR input angles and (b) mid-IR wavelengths. The FWHM of the intensities in (a) and (b) provides the angular and spectral acceptance bandwidth, respectively, for the upconversion process. The choice of ρc in (a) corresponds to the collinear case for that particular mid-IR wavelength and that in (b) corresponds to the value at which the peak intensity occurs at the central mid-IR wavelength used during the experiment.
    Fig. 5. Illustration of upconverted intensity as a function of (a) mid-IR input angles and (b) mid-IR wavelengths. The FWHM of the intensities in (a) and (b) provides the angular and spectral acceptance bandwidth, respectively, for the upconversion process. The choice of ρc in (a) corresponds to the collinear case for that particular mid-IR wavelength and that in (b) corresponds to the value at which the peak intensity occurs at the central mid-IR wavelength used during the experiment.
    Resolvability of the upconversion system. The USAF resolution target (top left) with green encircled portion indicates the region of the target that is upconverted; the upconverted image of the highlighted portion is at the top right. The intensity plot along a vertical strip (blue line) from the upconverted image is shown at the bottom. This strip contains the smallest feature of the target, and its corresponding intensity profile is enclosed within the green dotted ellipse.
    Fig. 6. Resolvability of the upconversion system. The USAF resolution target (top left) with green encircled portion indicates the region of the target that is upconverted; the upconverted image of the highlighted portion is at the top right. The intensity plot along a vertical strip (blue line) from the upconverted image is shown at the bottom. This strip contains the smallest feature of the target, and its corresponding intensity profile is enclosed within the green dotted ellipse.
    Illustration of chromatic blurring for broadband mid-IR light and a broad nonlinear acceptance bandwidth. (a) is a vectorial representation of the chromatic blurring effect. (b) shows the effect of a cone of incoming infrared angles being transferred as a blurred cone in the image plane. IP, image plane.
    Fig. 7. Illustration of chromatic blurring for broadband mid-IR light and a broad nonlinear acceptance bandwidth. (a) is a vectorial representation of the chromatic blurring effect. (b) shows the effect of a cone of incoming infrared angles being transferred as a blurred cone in the image plane. IP, image plane.
    Illustration of the net blurring effect. (a) shows the upconverted image. The dotted yellow circle shows the uncertainty of the collinear point. The four numbered sections correspond to four different locations in the image whose intensity versus pixel plot along the red and blue lines is given at the bottom. Red corresponds to tangential features, whereas blue corresponds to radial features with respect to the center. One pixel in the camera corresponds to 10 μm×10 μm. (b) shows the qualitative indication of net blurring at different locations in the image plane. (c) is a plot of the blurring in the object plane from different factors.
    Fig. 8. Illustration of the net blurring effect. (a) shows the upconverted image. The dotted yellow circle shows the uncertainty of the collinear point. The four numbered sections correspond to four different locations in the image whose intensity versus pixel plot along the red and blue lines is given at the bottom. Red corresponds to tangential features, whereas blue corresponds to radial features with respect to the center. One pixel in the camera corresponds to 10  μm×10  μm. (b) shows the qualitative indication of net blurring at different locations in the image plane. (c) is a plot of the blurring in the object plane from different factors.
    τleff (mm)ηMCPΔθ(°)Δλ (μm)ηT
    1 ns1013.320.010.11
    100 ps1013.320.010.11
    1 ps4.72.2×1014.760.020.099
    500 fs2.35.3×1026.670.040.094
    100 fs0.472.2×10314.810.20.097
    50 fs0.235.3×10420.980.3940.092
    Table 1. Representation of Values of leff for Different Values of Temporal Overlap τ and Indication of How It Affects Various Upconversion Parametersa
    Ashik A. S., Callum F. O’Donnell, S. Chaitanya Kumar, M. Ebrahim-Zadeh, P. Tidemand-Lichtenberg, C. Pedersen. Mid-infrared upconversion imaging using femtosecond pulses[J]. Photonics Research, 2019, 7(7): 783
    Download Citation