Ashik A. S.1、*, Callum F. O’Donnell2、3, S. Chaitanya Kumar2、3, M. Ebrahim-Zadeh2、3、4, P. Tidemand-Lichtenberg1, and C. Pedersen1
Abstract
Mid-infrared (mid-IR) imaging and spectroscopic techniques have been rapidly evolving in recent years, primarily due to a multitude of applications within diverse fields such as biomedical imaging, chemical sensing, and food quality inspection. Mid-IR upconversion detection is a promising tool for exploiting some of these applications. In this paper, various characteristics of mid-IR upconversion imaging in the femtosecond regime are investigated using a imaging setup. A fraction of the 100 fs, 80 MHz output from a Ti:sapphire laser is used to synchronously pump an optical parametric oscillator, generating 200 fs mid-IR pulses tunable across the 2.7–4.0 μm wavelength range. The signal-carrying mid-IR pulses are detected by upconversion with the remaining fraction of the original pump beam inside a bulk crystal, generating an upconverted field in the visible/near-IR range, enabling silicon-based CCD detection. Using the same pump source for generation and detection ensures temporal overlap of pulses inside the nonlinear crystal used for upconversion, thus resulting in high conversion efficiency even in a single-pass configuration. A theory is developed to calculate relevant acceptance parameters, considering the large spectral bandwidths and the reduced interaction length due to group velocity mismatch, both associated with ultrashort pulses. Furthermore, the resolution of this ultrashort-pulsed upconversion imaging system is described. It is demonstrated that the increase in acceptance bandwidth leads to increased blurring in the upconverted images. The presented theory is consistent with experimental observations.
1. INTRODUCTION
Mid-infrared (mid-IR) imaging and spectroscopy have received much attention in recent years due to their applicability across numerous fields, including chemical sensing [1], biomedical imaging [2], gas sensing [3], cancer detection [4–6], and detection of explosives [7]. Most complex chemicals have unique spectral signatures in the mid-IR region, facilitating unambiguous identification. A major challenge in mid-IR sensing is the lack of efficient detectors. Conventional mid-IR detectors based on semiconductor technology (photon detectors) are limited by their low bandgap, coinciding with the thermal radiation energy from room-temperature objects, leading to a need for complex cooling systems [8]. On the other hand, bolometers (thermal detectors) are mainly limited by the trade-off between response time and sensitivity [8], in addition to the stringent cooling requirements. These limitations have motivated research in alternative methods—simpler yet efficient mid-IR detection schemes. Sum-frequency generation (SFG) using a second-order nonlinear crystal can be used to convert a mid-IR signal to the visible/near-infrared (NIR) region, enabling easy detection using silicon-based detectors. The upconversion technique was suggested as a viable alternative for mid-IR detection as early as the 1960s [9,10]. It is a particularly effective technique for low brightness signals, since it is inherently a low-noise conversion process. It conserves spatial and spectral properties of the signal while allowing for the use of silicon-based detectors, thereby eliminating the need for cooling and providing faster response. Even though silicon-based detector technology has been well established for decades, the implementation of the upconversion technology remained limited, primarily due to the low upconversion efficiency of the nonlinear crystal. The resurgence of upconversion technology in recent years can be attributed to the advent of new nonlinear materials with high conversion efficiency and the availability of high-power, high-repetition-rate laser sources.
Ultrashort-pulsed upconversion is of particular interest because of the increased array of possibilities offered, including pump-probe experiments and studies of relaxation dynamics of chemicals and molecules [11–13]. State-of-the-art femtosecond optical parametric oscillators (OPOs) offer broad mid-IR wavelength coverage with high peak power, leading to a high signal-to-noise ratio and a reduced risk of incurring damage to delicate samples [14]. Additionally, the high peak power provided by ultrafast laser sources eliminates the need for intracavity upconversion typically associated with continuous-wave (CW) incoherent light conversion [15,16], facilitating single-pass configurations [17,18]. Ultrashort-pulsed upconversion requires effective temporal overlap of the interacting pulses inside the nonlinear crystal, which becomes progressively more difficult to achieve as the pulse duration decreases. Timing jitter between the signal and pump can further add to this difficulty. Using the same pump source for the mid-IR generation and the upconversion process improves the long-term stability of the system and adds simplicity by ensuring the pulse overlap. The principle of synchronous femtosecond upconversion was previously demonstrated [19], where pulses at 1500 nm were upconverted to the visible using a crystal in the image plane of a imaging system.
In this paper, we report on the first demonstration of femtosecond mid-IR upconversion imaging using SFG in the Fourier plane of a imaging setup. The theory, developed in Ref. [20], is not applicable for pulse durations below the picosecond time scale because it does not account for the reduced interaction length in the crystal due to temporal walk-off as a result of group velocity mismatch (GVM) between the signal and pump. This paper is organized as follows. First, the experimental setup is introduced, followed by a theoretical model describing the properties of upconversion imaging in the femtosecond regime. This theory is then used to explain the experimental observations and to calculate the acceptance parameters. Finally, we present a discussion on the imaging properties of the system.
Sign up for Photonics Research TOC. Get the latest issue of Photonics Research delivered right to you!Sign up now
2. EXPERIMENTAL SETUP
The experimental setup used for femtosecond synchronous upconversion imaging is shown in Fig. 1. A Kerr lens mode-locked (KLM) Ti:sapphire laser (Spectra Physics, Mai Tai HP) is used as the fundamental pump laser source, providing transform-limited pulses at a repetition rate of 80 MHz. Up to 2 W of average power is available at a central wavelength of 804 nm. Using the combination of a half-wave plate and a polarizing beam splitter, a large portion of the beam (1.3 W) is diverted to a synchronously pumped OPO, based on type-0 quasi-phase-matching in a 1-mm-long MgO:PPLN crystal. All cavity mirrors are coated for high reflection () of the near-IR signal beam over 1–1.4 μm, while the mid-IR idler is coupled out through a dichroic mirror with high transmission () across 3–5 μm. A fan-out quasi-phase-matched (QPM) grating structure () facilitates rapid and continuous idler tuning across 2.7–4 μm, with an average output power ranging from 80 to 100 mW. The mid-IR idler pulse duration is governed by the dispersion and GVM in the MgO:PPLN and is estimated to be outside the OPO. The mid-IR spectra are measured to span a full width at half-maximum (FWHM) bandwidth of using a mid-IR spectrum analyzer. Wavelength tuning is accomplished by transverse translation of the OPO crystal while adjusting the cavity length to vary the resonating signal wavelength.
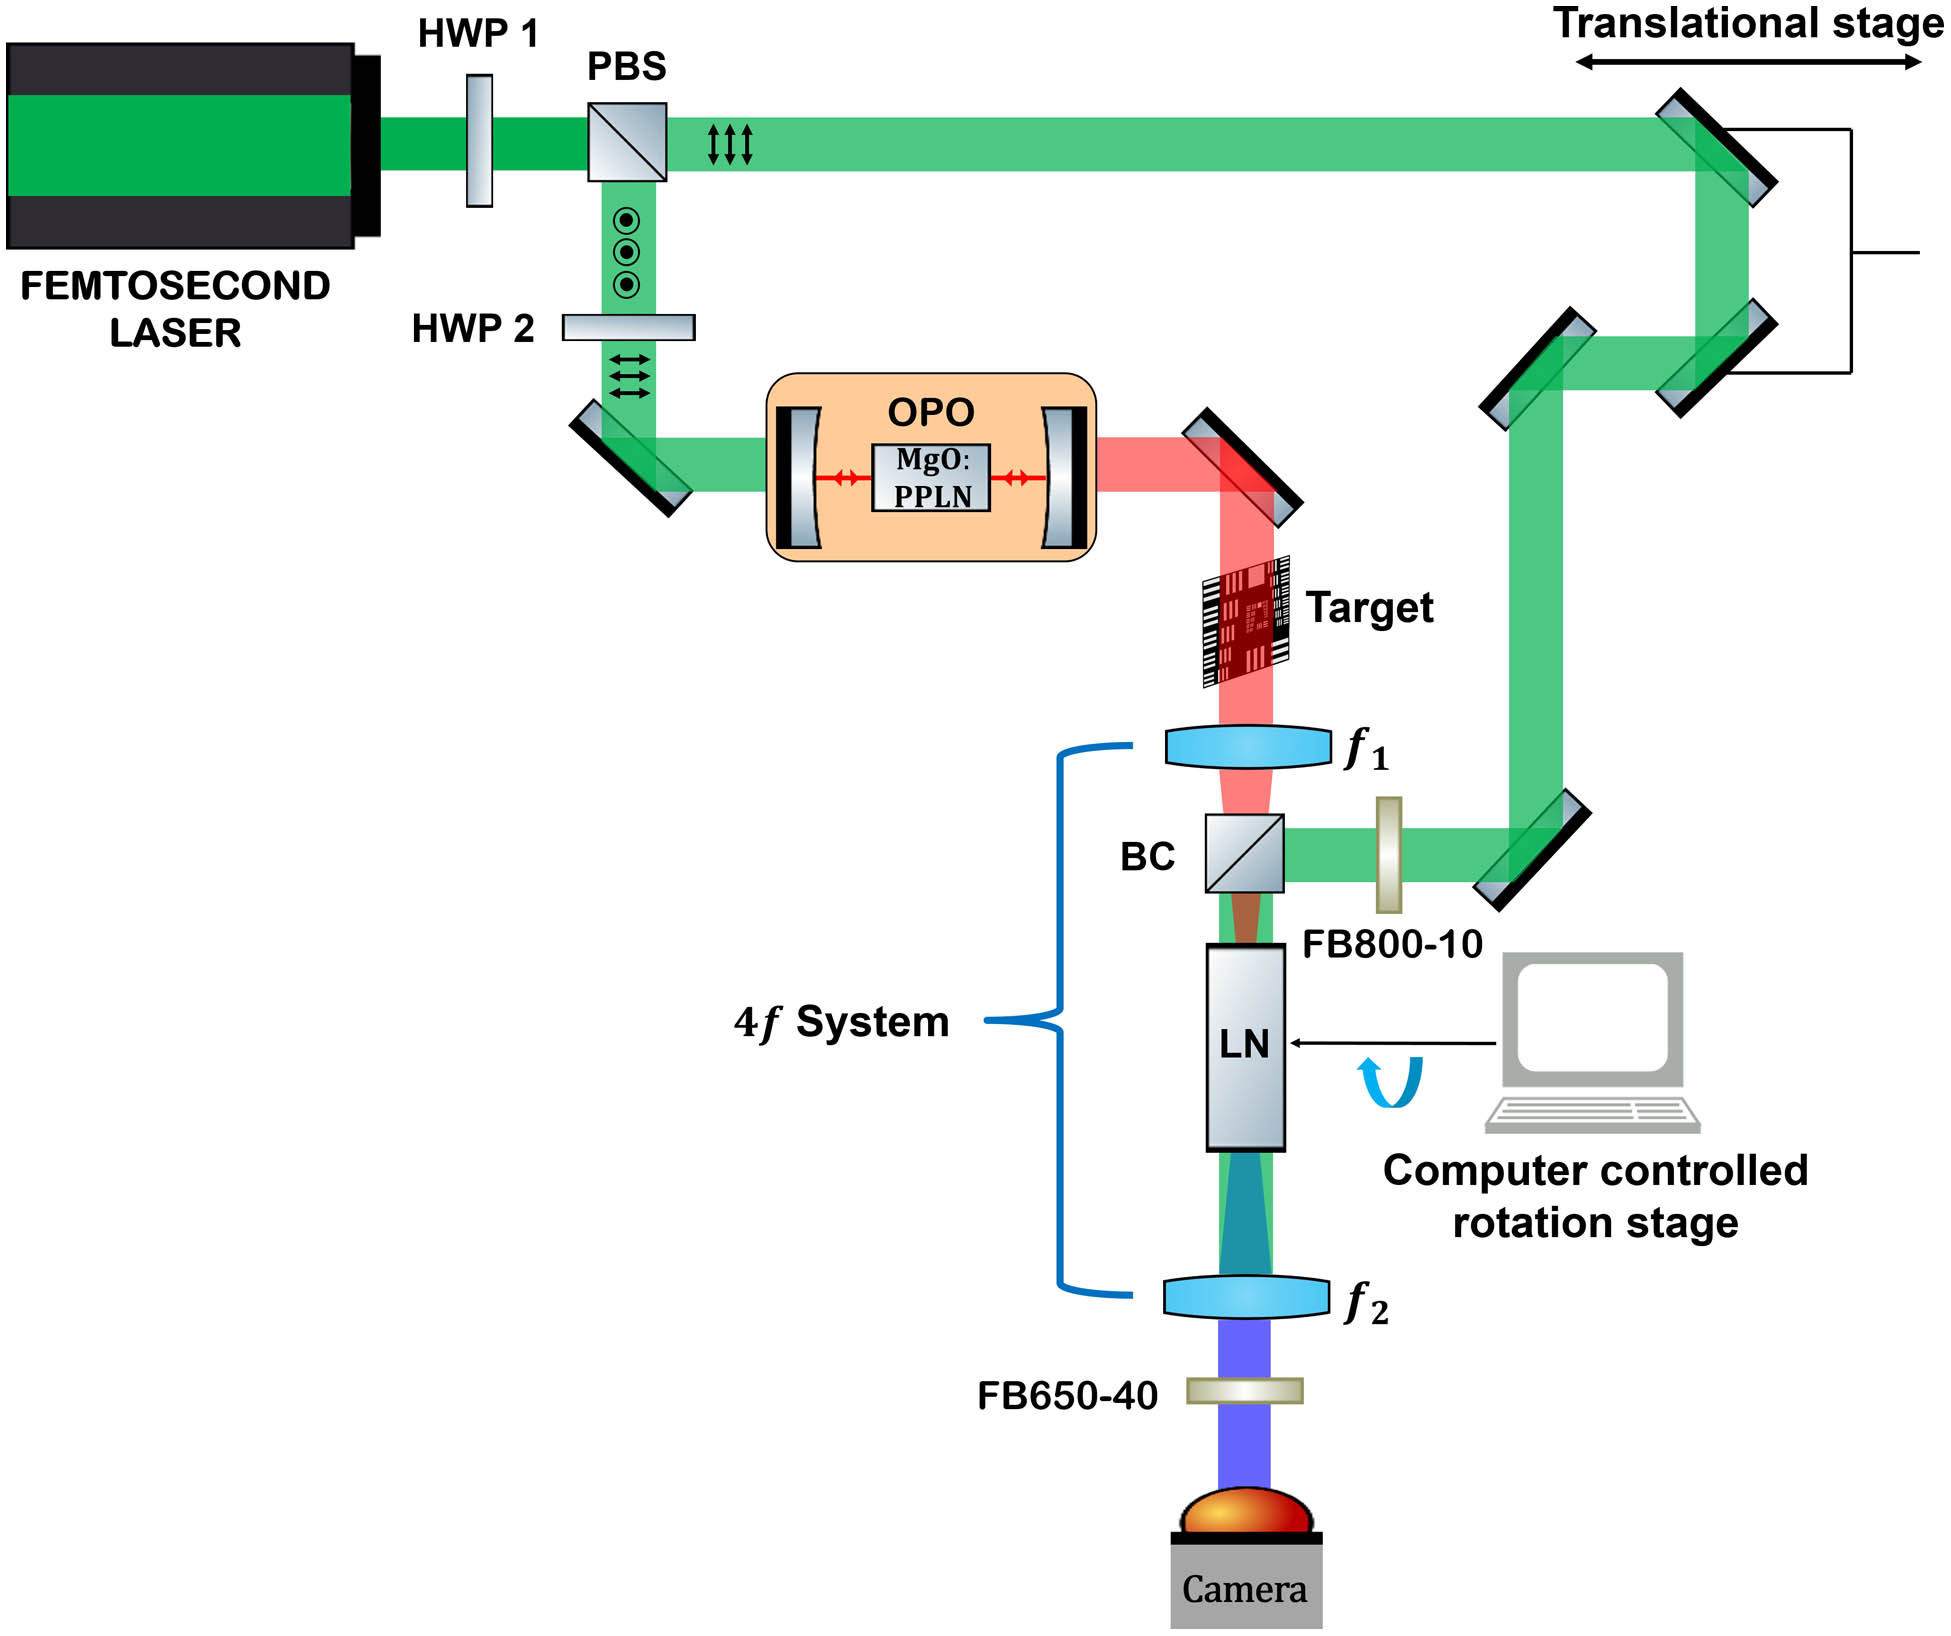
Figure 1.Schematic of the experimental setup used for mid-IR femtosecond upconversion imaging. HWP, half-wave plate; PBS, polarizing beam splitter; OPO, optical parametric oscillator; BC, beam combiner; LN, lithium niobate crystal; MgO:PPLN, magnesium oxide-doped periodically poled LN crystal; , lenses.
For the upconversion stage, the mid-IR light is collimated to a beam diameter of 12 mm and illuminates a USAF resolution target before being focused by an lens into a congruently grown undoped bulk crystal placed in the Fourier plane of a imaging setup. Meanwhile, the remaining pump beam centered at 804 nm and having a beam diameter of 2.6 mm is combined coaxially with the mid-IR beam, using a dichroic beam splitter with high mid-IR transmittance (). Due to losses at the beam combiner, only of pump light is incident on the crystal; however, the high peak power still ensures efficient upconversion. A delay line, consisting of a precision translation stage in the pump beam path, enables pulse synchronization to be finely controlled. After the crystal, multiple short-pass filters (Thorlabs FES-750 and FESH-800) and a bandpass filter block the remaining pump beam. Furthermore, an bandpass filter is placed in the pump beam path in order to block small amounts of parasitic red light originating from nonphase-matched SFG in the OPO crystal getting reflected by the first half-wave plate into the pump beam path. The upconversion crystal is 10-mm-long and cut for birefringent phase-matching at an angle of ° relative to the optical axis, supporting SFG from the mid-IR to visible/NIR under type-I phase-matching. A computer-controlled rotation stage allows the phase-matching angle to be precisely adjusted to facilitate phase-matched SFG for different mid-IR wavelengths. The upconverted visible light is collimated by an lens and detected by a silicon CCD camera (Andor Luca S 658M).
3. THEORY AND RESULTS
In this work, we propose a theory combining the effect of the finite bandwidth of the interacting fields and the reduced interaction length inside the nonlinear crystal resulting from GVM, enabling the calculation of key parameters of the 100 fs upconversion imaging system. Ultrashort pulses have a broad spectral bandwidth (). For a Fourier-transform-limited (FTL) Gaussian pulse at center wavelength and having a pulse duration , the FWHM spectral bandwidth can be calculated as . The pump pulse at 804 nm has an FTL bandwidth of , as also confirmed using a spectrum analyzer. The OPO was tuned to provide three different mid-IR wavelengths at 2.851, 3.206, and 3.682 μm. The mid-IR pulses at each of these central wavelengths had a spectral bandwidth of , with slight variations. The measured bandwidth is significantly larger than the calculated FTL bandwidth of 150 nm, likely due to the mid-IR field of the OPO being nonresonant. The GVM between the interacting fields leads to temporal walk-off between the pulses as they propagate through the crystal, making the effective interaction length shorter than the total crystal length. The reduced interaction length influences the calculation of upconversion efficiency as well as the spectral and angular acceptance parameters. For a typical 10-mm-long crystal, the GVM-limited interaction length is not prominent in the picosecond pulse regime, but becomes increasingly important, as the pulse duration gets below 1 ps.
Any parametric frequency mixing process involves strict energy conservation. The relation between the wavelengths of the interacting fields is dictated by the energy conservation condition and can thus be represented as (from here on, the suffixes “pump,” “ir,” and “up” represent the pump, mid-IR, and upconverted field, respectively). On the other hand, the phase-matching requirement between the interacting fields is not strict, meaning that considerable upconversion can still be observed for a slight phase mismatch. In this particular experiment, type-I phase-matching is implemented, wherein the pump and the mid-IR fields are ordinarily polarized and the generated field is extraordinarily polarized. Upconversion imaging performed in the Fourier plane suggests that each point in the 2D object plane is converted to a plane wave with a uniquely defined angle (incoming mid-IR angle) inside the crystal. Therefore, by simultaneously solving the noncollinear phase-matching condition and energy conservation condition, one can obtain the possible combination of angles and wavelengths that can be noncollinearly phase-matched. To facilitate further calculations, we refer to Fig. 2 showing the orientation of the crystal (blue rectangle) with respect to the different fields, including the various angles used to develop the theory. Taking the possibility of crystal rotation () into account, Tidemand-Lichtenberg et al. described in detail the calculation of the phase-matching curve for plane-wave interaction [21]. The same methodology is implemented for relevant phase-matching calculations in the following section.

Figure 2.Illustration of various angles used in the calculations. Description of different lines used is included in the figure. represents the optic axis of the crystal, is the angle between the mid-IR field and the pump field, is the angle between the upconverted field and the pump field, is the cutting angle of the crystal with respect to the axis, is the external crystal rotation angle with respect to the pump field, and is the angle between the extraordinary upconverted field and the axis. The pump field direction is considered to be fixed.
As described in Ref. [21], the vectorial phase-matching condition ( or ) can be resolved into two scalar components, namely, longitudinal and transverse phase mismatch. The assumption of a large pump beam diameter and plane-wave interaction imposes strict cancellation of any transverse phase mismatch. This provides the relation between the incoming mid-IR and output upconverted angles as where is the angle-dependent refractive index of the extraordinarily polarized upconverted field and is the ordinary refractive index of the mid-IR field. The external mid-IR input angles in our experiment are confined to be symmetric about the direction of the pump beam to a maximum cone angle of 13.68°, as dictated by the incoming mid-IR beam diameter, , and choice of lens, (; ). With the transverse component of being zero, only the longitudinal phase mismatch, , influences the upconversion efficiency. Crystal rotation angle, mid-IR input angle, mid-IR wavelength, and pump wavelength are the parameters that influence , and can be expressed as where and represent the refractive index and wavelength, respectively, of the pump field. and are parameters dependent upon , , and . Furthermore, the quantity, also depends on through the relation , where is the crystal rotation angle with respect to the pump field inside the crystal. Assuming negligible pump depletion, and assuming that the temporal pulse shapes are square and of equal duration (for simplicity), the upconverted intensity is given as [22] where , is the effective nonlinear coefficient, represents the intensity, is the vacuum permittivity, and is the vacuum speed of light. Upconversion ceases when the input fields (mid-IR and pump) temporally separate due to the GVM between the input fields. The term , in Eq. (3), is the effective interaction length of the crystal calculated for the GVM between the mid-IR and pump field. It is given as [23] where is the duration over which the pulses effectively overlap, and is the group velocity. The value of can be calculated as a convolution of the two temporal Gaussian pulses and is found to be 225 fs. The values of are calculated to be 0.85, 1.1, and 1.8 mm for the central mid-IR wavelengths of 2.851, 3.206, and 3.682 μm, respectively. From Eq. (3), it is evident that the upconverted intensity depends on all parameters that influence . Thus, a realistic calculation of the upconverted intensity should take into account the entire span of each of these parameters. Integrating the contribution from each parameter over its respective range will give the final upconverted intensity. Both pump and mid-IR beam have a Gaussian spectral profile, and it is therefore important to include a Gaussian weighting function during the integration. Let and denote the Gaussian spectral intensity profile of the mid-IR field and the pump field, respectively. The total upconverted intensity considering the broad-angled input mid-IR field and broadband pump and mid-IR pulse, is represented as The sinc function in the above equation accounts for the influence of longitudinal phase mismatch on the upconverted intensity. We are more interested in understanding the influence of the sinc function in determining the spread of the upconverted intensity profile, rather than the absolute value of upconverted intensity. For validation of the developed theory, the intensity as a function of crystal rotation angle () is theoretically determined. Figure 3 shows the various stages during the calculation of scaled upconverted intensity as a function of crystal rotation angle, , for a noncollinear, nonperfect phase-matched, ultrashort-pulsed upconversion system. Figures 3(a)–3(c) demonstrate the procedure for calculation of for the central mid-IR wavelength of 3.206 μm.
Figure 3.Calculation of . (a) shows the contribution to from different mid-IR input angles; (b) shows the contribution to from all mid-IR angles and wavelengths; (c) shows the contribution to from all mid-IR angles and all mid-IR and pump wavelengths. The spectral weighing is applied at all mid-IR and pump wavelengths, respectively, in (b) and (c). The peak of intensity at each wavelength traces a Gaussian profile. (d) shows the final upconverted intensity for the three experimental central mid-IR wavelengths.
We assume uniform distribution of incoming mid-IR intensity across the entire mid-IR angles. Figure 3(a) corresponds to the integration of the sinc function in Eq. (5) over all the mid-IR angles for a particular and . Only five angles are shown here for simplicity of representation. represents intensities at each mid-IR angle and represents the net intensity after integration. is carried forward to the next step of the integration. Figure 3(b) shows the integration of the sinc function over all mid-IR angles and wavelengths at . The net result of integration is represented as and is used in the next step of the integration. Again, only five mid-IR wavelengths are shown for ease of representation. Figure 3(c) shows the complete implementation of Eq. (5) for the calculation of . Only five pump wavelengths are shown here. Gaussian spectral weighing is applied for mid-IR and pump wavelengths, respectively, in Figs. 3(b) and 3(c), with maximum weight for the central wavelength. Figure 3(d) shows the appropriately scaled upconverted intensity calculated for all three central mid-IR wavelengths, taking into account the entire span of mid-IR angles, and mid-IR and pump wavelengths.
In order to validate the theory, the range of crystal rotation angles for which an upconverted signal could be measured () was determined experimentally by rotating the crystal. Theoretically, was determined by calculating the 10% width of in Fig. 3(d). Figure 4 shows the comparison of experimental and theoretical values of plotted for different central mid-IR wavelengths. The difference in the experimental values at shorter mid-IR wavelengths can be attributed to the physical limitation introduced by the optics and the size of the camera chip (not all light was captured by the camera). The magnification factor decreases with an increase in mid-IR wavelength, meaning that for a fixed object size (mid-IR beam diameter), the image size decreases with increasing mid-IR wavelength. Due to the phase-matching condition, the upconverted image will have rings whose diameter increases as we move away from the collinear crystal rotation angle. Illuminating with a mid-IR beam diameter of 12 mm at the central wavelength of 2.851 μm, the largest upconverted ring, corresponding to the farthest crystal rotation angle, is larger than the detector area () and thus is not detected. On the other hand, due to lower magnification, even the largest upconverted ring falls on the detector for the central mid-IR wavelength of 3.682 μm.
Figure 4.Comparison of experimental and theoretical values of for the three different mid-IR wavelengths.
The theory developed here can be used to calculate the angular and spectral acceptance bandwidth of the nonlinear process. The scaled upconverted intensity with respect to mid-IR angles , for a fixed , can be calculated by performing integration in Eq. (5) over the entire mid-IR and pump wavelengths. Performing similar integration over all mid-IR angles and pump wavelengths gives for a fixed . Figure 5 shows the plot of scaled upconversion intensity as functions of mid-IR angles and wavelengths. The FWHM criterion is utilized to calculate the acceptance bandwidth from the intensity profile. An angular acceptance bandwidth () as high as 20° (at ) and a spectral acceptance bandwidth () as high as 147 nm (at ) are theoretically calculated, with both parameters highly influenced by the reduced interaction length of the fields inside the crystal.
Figure 5.Illustration of upconverted intensity as a function of (a) mid-IR input angles and (b) mid-IR wavelengths. The FWHM of the intensities in (a) and (b) provides the angular and spectral acceptance bandwidth, respectively, for the upconversion process. The choice of in (a) corresponds to the collinear case for that particular mid-IR wavelength and that in (b) corresponds to the value at which the peak intensity occurs at the central mid-IR wavelength used during the experiment.
It is important to understand the influence of on the upconversion efficiency and the acceptance parameters. The term outside the sinc function in Eq. (5) scales the upconverted intensity, and consequently affects the upconversion efficiency. The sinc function determines the acceptance bandwidth of the upconversion process, and thus inside the sinc function influences the acceptance parameters. For a proper choice of in an ultrashort-pulsed system, the large spectral bandwidth due to short pulse duration, combined with the large acceptance bandwidth due to reduced interaction length, results in a large field of view (FoV) for the upconversion imaging process.
GVM becomes increasingly prominent when approaching shorter pulse regimes. Table 1 summarizes the values of and its influence on efficiency and acceptance bandwidths for different values of in a crystal. The following assumptions have been made for the calculation of parameters in Table 1: the pump beam is monochromatic, crystal length is 10 mm, and type-I phase matching is used. Additionally, for the calculation of angular acceptance bandwidth (), the spectral bandwidth of the source is not considered, and for the calculation of spectral acceptance bandwidth (), only the collinear mid-IR angle is considered.
| τ | leff (mm) | ηMCP | Δθ (°) | Δλ (μm) | ηT |
| 1 ns | 10 | 1 | 3.32 | 0.01 | 0.11 |
| 100 ps | 10 | 1 | 3.32 | 0.01 | 0.11 |
| 1 ps | 4.7 | 2.2×10⁻¹ | 4.76 | 0.02 | 0.099 |
| 500 fs | 2.3 | 5.3×10⁻² | 6.67 | 0.04 | 0.094 |
| 100 fs | 0.47 | 2.2×10⁻³ | 14.81 | 0.2 | 0.097 |
| 50 fs | 0.23 | 5.3×10⁻⁴ | 20.98 | 0.394 | 0.092 |
Table 1. Representation of Values of for Different Values of Temporal Overlap and Indication of How It Affects Various Upconversion Parametersa
From Table 1, it is evident that reduces considerably for shorter pulse durations. This, in turn, leads to a significant reduction in the monochromatic collinear plane (MCP) wave upconversion efficiency as a result of its square dependence on . Nevertheless, reduced leads to increased and . The overall efficiency for the upconversion process can be roughly estimated using the relation . It is important here to emphasize that the overall efficiency remains almost constant even though decreases with overlap duration. This indicates that the reduction in efficiency due to reduced interaction length is almost entirely compensated by the increase in angular and spectral acceptance bandwidth, provided the spectral bandwidth of the source is greater than or equal to . Measuring the mid-IR and upconverted power enables us to calculate the conversion efficiency of the process. The ratio of the number of upconverted photons to the number of mid-IR photons gives the experimental quantum efficiency, which was found to be of the order of for the current experiment. The large value for angular acceptance bandwidth can enable single-shot upconversion imaging with a wide FoV without any alterations to the phase-match condition, for example, by rotation of the crystal. Likewise, the large value of spectral acceptance bandwidth makes the ultrashort-pulsed upconversion technique highly interesting for broadband spectroscopy.
4. RESOLUTION FOR AN ULTRASHORT-PULSED UPCONVERSION SYSTEM
The following section deals with resolution characteristics of an ultrashort-pulsed upconversion imaging system. Resolution is an important parameter of any imaging system; it is often defined as the ability of the system to distinguish two adjacent features in the object plane when imaged. A detailed theory of upconversion imaging for incoherent noncollinear illumination is discussed in Refs. [24,25]. The Gaussian pump profile at the crystal acts as a soft aperture during imaging, meaning that the point spread function (PSF) sets the limit of the maximum resolution of the system [24–26]. Recalling the Rayleigh criterion for resolution and using the Gaussian PSF (absolute square of the Fourier transform of the Gaussian pump electric field), we can define the maximum theoretical resolution to be diameter of the PSF. This can be expressed as where denotes the resolution in the object plane, denotes the pump beam diameter (2.6 mm) in the crystal, and denotes the focal length of the imaging lens. Substituting the experimental values into Eq. (6), the maximum resolution of the system is found to be 56 μm at a mid-IR wavelength of 3.206 μm. Figure 6 shows the upconverted image of a USAF resolution target captured with 0.47 ms integration time. The smallest feature in the resolution target is 14.25 lines/mm (70.16 μm). The calculated resolution is lower than this value, and the smallest features are clearly resolved with a fringe visibility of the lines being greater than the Rayleigh limit, as shown in Fig. 6. The amount of blurring in the image plane for a point in the object plane is the diameter of the Gaussian PSF (). When converted using the magnification factor, this diameter gives the blurring in the object plane, as calculated from Eq. (6). The blurring due to the PSF is uniform throughout the image plane.
Figure 6.Resolvability of the upconversion system. The USAF resolution target (top left) with green encircled portion indicates the region of the target that is upconverted; the upconverted image of the highlighted portion is at the top right. The intensity plot along a vertical strip (blue line) from the upconverted image is shown at the bottom. This strip contains the smallest feature of the target, and its corresponding intensity profile is enclosed within the green dotted ellipse.
For an ultrashort-pulsed upconversion imaging system such as the femtosecond system under consideration, the spectral acceptance bandwidth is large compared to a CW system, due to the reduced effective interaction length. Recalling the earlier assumption that the transverse phase mismatch is zero, the relation between the mid-IR and upconverted angle inside the crystal is governed by Eq. (1), showing that each input mid-IR angle has a uniquely defined upconverted angle. This one-to-one correspondence between a point in the object plane and a point in the image plane is not valid for broad spectral acceptance bandwidths wherein a particular object point transforms into a set of upconverted angles. Figure 7 illustrates the spread of the upconverted angles for different spectral components originating from the same point in the object plane. A large spectral acceptance bandwidth for the mid-IR (red dotted line) results in being spread over an angular range of as a result of the different magnification for different wavelength components, as shown in Fig. 7(a). For the collinear case (), the upconverted angular spread is always zero, independent of the spectral acceptance bandwidth. Further away from the center, the spread in the upconverted angles, represented by , becomes more pronounced, introducing blurring in the image plane. This chromatic blurring effect has, to the authors’ best knowledge, never been discussed in the literature. Considering a cone of mid-IR angles incident on the crystal, as shown in Fig. 7(b), translates it into a spread in the image plane, . The result is a blurring, by an amount of in the radial direction of the image plane, which we refer to as chromatic blurring.
Figure 7.Illustration of chromatic blurring for broadband mid-IR light and a broad nonlinear acceptance bandwidth. (a) is a vectorial representation of the chromatic blurring effect. (b) shows the effect of a cone of incoming infrared angles being transferred as a blurred cone in the image plane. IP, image plane.
As we move to the ultrashort pulse regime, the net blurring in the image plane becomes a combination of the blurring due to PSF and the chromatic blurring. Hence, the blurring for the ultrashort-pulsed upconversion imaging can be considered as the nonuniform radial blurring in the image. The blurring at the center of the image is dictated by the PSF; while moving away from the center, an additional contribution due to chromatic blurring leads to increasing blurring in the radial direction. The magnification factor can be suitably used to convert the blurring in the image plane to that in the object plane. Figure 8 shows the qualitative indication of the blurring observed experimentally, as well as the theoretical estimate of the net blurring. The radial blurring is qualitatively seen in the upconverted image shown in Fig. 8, wherein the transition from the dark section to the bright portion is clearly more blurred in the radial direction than in the tangential direction, and more so at larger distance from the center. Radial (chromatic) blurring is seen at positions 1, 2, and 3; however, it is less pronounced close to the center (position 4); see Fig. 8(a), which is consistent with the theory. Qualitative simulation of the radial increase in blurring in the image plane is shown in Fig. 8(b). Figure 8(c) shows the different contributions to the blurring in the object plane. The blurring from the PSF is uniform over the entire FoV, while the chromatic blurring increases radially from the center. In the upconverted image in Fig. 6, the smallest features in the resolution target were aligned to match the collinear phase-matched region, which allows evaluation of the maximum resolution of the system. The upconverted image in Fig. 6 was cropped to focus on the smallest features. The chromatic blurring effect is not visible here due to the close proximity to the collinear region.
Figure 8.Illustration of the net blurring effect. (a) shows the upconverted image. The dotted yellow circle shows the uncertainty of the collinear point. The four numbered sections correspond to four different locations in the image whose intensity versus pixel plot along the red and blue lines is given at the bottom. Red corresponds to tangential features, whereas blue corresponds to radial features with respect to the center. One pixel in the camera corresponds to . (b) shows the qualitative indication of net blurring at different locations in the image plane. (c) is a plot of the blurring in the object plane from different factors.
Another important parameter characterizing the quality of an imaging system is the maximum number of resolvable elements (MRE), which is the ratio of FoV area to the area of the smallest resolvable element. Since the blurring in the image plane, and consequently the size of the smallest resolvable element, are nonuniform for the ultrashort-pulsed upconversion imaging system, it is impractical to determine a definitive value for the MRE. Nevertheless, a maximum resolution of 56 μm is achievable in the collinear region using the current upconversion setup.
5. CONCLUSION
A femtosecond mid-IR upconversion imaging system has been successfully demonstrated for the first time, with the nonlinear crystal placed in the Fourier plane of a setup. In addition to extended calculation of the phase-matching condition, the effect of the GVM between the signal and pump pulses has been evaluated in relation to the acceptance parameters as well as to efficiency. It is evident that the GVM-limited interaction length governs the upconversion parameters when moving to ultrashort pulse regimes. The developed theoretical model is consistent with the experimental data. It is well known that a larger FoV can be observed if the interacting fields are broadband in nature, but here it is shown that the GVM can play an important role in further increasing this parameter. A broad spectral bandwidth of the infrared pulse combined with GVM-limited interaction length leads to large angular and spectral acceptance bandwidths, suggesting that wide FoV mid-IR upconversion imaging or broadband spectroscopy is possible without any moving parts. We also identify and describe for the first time a broadband chromatic blurring effect that can seriously deteriorate the image resolution when performing ultrashort-pulsed upconversion. The theory developed enables calculation of key upconversion parameters for an ultrashort-pulsed upconversion system.
Acknowledgment
Acknowledgment. The authors thank Laurent Huot, Saher Junaid, and Ajanta Barh for fruitful discussions.
References
[1] J. M. Chalmers, P. R. Griffiths. Handbook of Vibrational Spectroscopy(2002).
[2] M. J. Walsh, R. K. Reddy, R. Bhargava. Label-free biomedical imaging with mid-IR spectroscopy. IEEE J. Sel. Top. Quantum Electron., 18, 1502-1513(2012).
[3] D. Richter, A. Fried, P. Weibring. Difference frequency generation laser based spectrometers. Laser Photon. Rev., 3, 343-354(2009).
[4] S. Kumar, C. Desmedt, D. Larsimont, C. Sotiriou, E. Goormaghtigh. Change in the microenvironment of breast cancer studied by FTIR imaging. Analyst, 138, 4058-4065(2013).
[5] G. Shetty, C. Kendall, N. Shepherd, N. Stone, H. Barr. Raman spectroscopy: elucidation of biochemical changes in carcinogenesis of oesophagus. Br. J. Cancer, 94, 1460-1464(2006).
[6] R. Bhargava. Towards a practical Fourier transform infrared chemical imaging protocol for cancer histopathology. Anal. Bioanal. Chem., 389, 1155-1169(2007).
[7] C. Bauer, A. K. Sharma, U. Willer, J. Burgmeier, B. Braunschweig, W. Schade, S. Blaser, L. Hvozdara, A. Müller, G. Holl. Potentials and limits of mid-infrared laser spectroscopy for the detection of explosives. Appl. Phys. B, 92, 327-333(2008).
[8] A. Rogalski. Infrared Detectors(2010).
[9] J. E. Midwinter, J. Warner. Up-conversion of near infrared to visible radiation in lithium-meta-niobate. J. Appl. Phys., 38, 519-523(1967).
[10] J. Warner. Parametric up-conversion from the infrared. J. Opto-Electron., 3, 37-48(1971).
[11] M. El-Sayed, M. Mohamed, C. Burda, S. Link. The relaxation pathways of CdSe nanoparticles monitored with femtosecond time-resolution from the visible to the IR: assignment of the transient features by carrier quenching. J. Phys. Chem. B, 105, 12286-12292(2001).
[12] C. Bonetti, M. T. A. Alexandre, I. H. M. Van Stokkum, R. G. Hiller, M. L. Groot, R. Van Grondelle, J. T. M. Kennis. Identification of excited-state energy transfer and relaxation pathways in the peridinin-chlorophyll complex: an ultrafast mid-infrared study. Phys. Chem. Chem. Phys., 12, 9256-9266(2010).
[13] H. K. Nienhuys, R. A. Van Santen, H. J. Bakker. Orientational relaxation of liquid water molecules as an activated process. J. Chem. Phys., 112, 8487-8494(2000).
[14] J. Herz, V. Siffrin, A. E. Hauser, A. U. Brandt, T. Leuenberger, H. Radbruch, F. Zipp, R. A. Niesner. Expanding two-photon intravital microscopy to the infrared by means of optical parametric oscillator. Biophys. J., 98, 715-723(2010).
[15] N. Huang, H. Liu, Z. Wang, J. Han, S. Zhang. Femtowatt incoherent image conversion from mid-infrared light to near-infrared light. Laser Phys., 27, 035401(2017).
[16] A. J. Torregrosa, H. Maestre, J. Capmany. Intra-cavity upconversion to 631 nm of images illuminated by an eye-safe ASE source at 1550 nm. Opt. Lett., 40, 5315-5318(2015).
[17] M. Mathez, P. J. Rodrigo, P. Tidemand-Lichtenberg, C. Pedersen. Upconversion imaging using short-wave infrared picosecond pulses. Opt. Lett., 42, 579-582(2017).
[18] S. Wolf, T. Trendle, J. Kiessling, J. Herbst, K. Buse, F. Kühnemann. Self-gated mid-infrared short pulse upconversion detection for gas sensing. Opt. Express, 25, 24459-24468(2017).
[19] L. Pattelli, R. Savo, M. Burresi, D. S. Wiersma. Spatio-temporal visualization of light transport in complex photonic structures. Light Sci. Appl., 5, e16090(2016).
[20] H. Maestre, A. J. Torregrosa, J. Capmany. IR image upconversion using band-limited ASE illumination fiber sources. Opt. Express, 24, 8581-8593(2016).
[21] P. Tidemand-Lichtenberg, J. S. Dam, H. V. Andersen, L. Høgstedt, C. Pedersen. Mid-infrared upconversion spectroscopy. J. Opt. Soc. Am. B, 33, D28-D35(2016).
[22] R. W. Boyd. Nonlinear Optics(2008).
[23] B. E. A. Saleh, M. C. Teich. Fundamentals of Photonics(2013).
[24] J. S. Dam, C. Pedersen, P. Tidemand-Lichtenberg. Theory for upconversion of incoherent images. Opt. Express, 20, 1475-1482(2012).
[25] C. Pedersen, Q. Hu, L. Høgstedt, P. Tidemand-Lichtenberg, J. S. Dam. Non-collinear upconversion of infrared light. Opt. Express, 22, 28027-28036(2014).
[26] C. Pedersen, E. Karamehmedović, J. S. Dam, P. Tidemand-Lichtenberg. Enhanced 2D-image upconversion using solid-state lasers. Opt. Express, 17, 20885-20890(2009).

