
Zhenyang Hui, Haiying Hu, Na Li, Zhuoxuan Li. Airborne LiDAR Point Cloud Filtering Method Based on Multiconstrained Connected Graph Segmentation[J]. Laser & Optoelectronics Progress, 2022, 59(4): 0428004
- Laser & Optoelectronics Progress
- Vol. 59, Issue 4, 0428004 (2022)
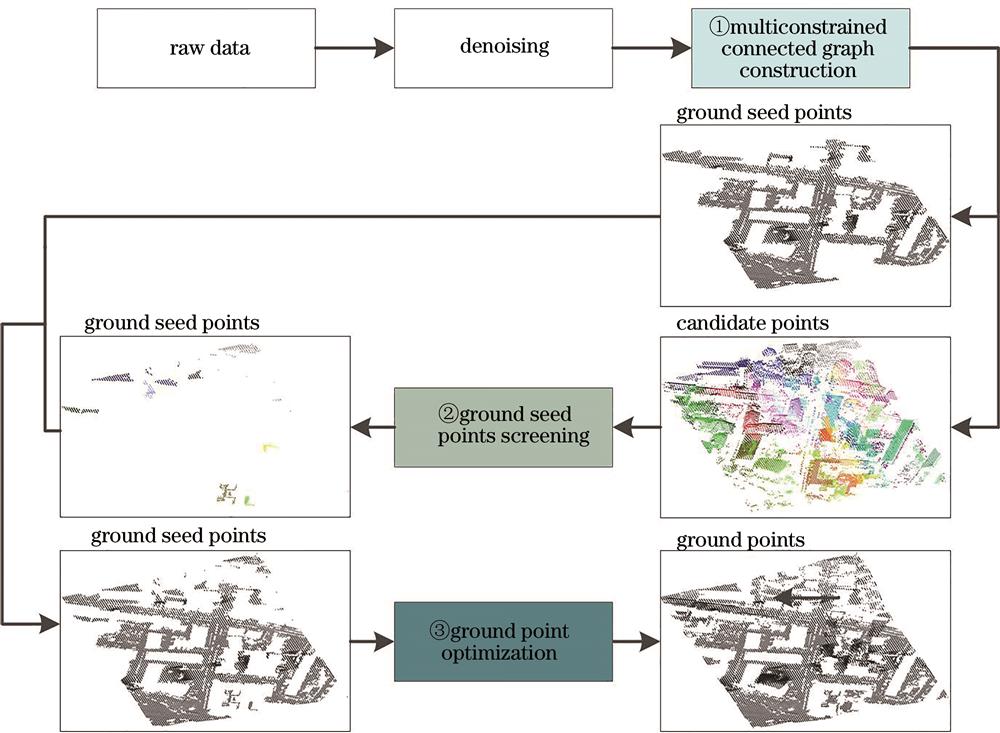
Fig. 1. Flow chart of point cloud filtering
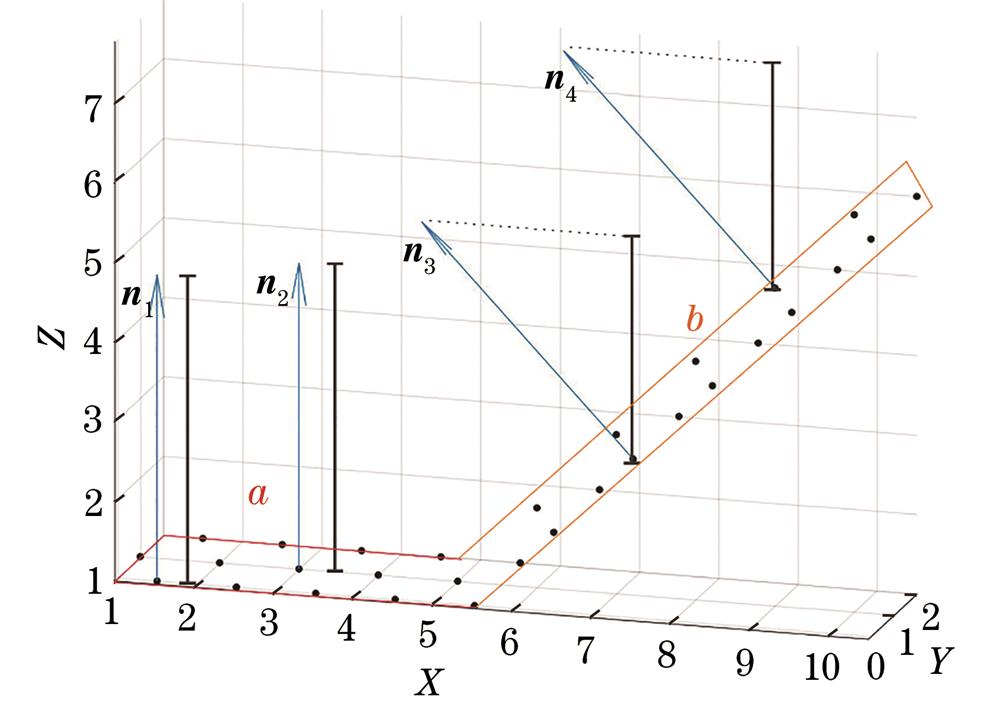
Fig. 2. Diagram of verticality
Fig. 3. Diagram of height difference constraint and distance condition constraint
Fig. 4. Diagram of connected graph. (a) Connected graphs without constraints; (b) connected graphs with constraints
Fig. 5. Two dimensional grid diagram of seed points
Fig. 6. Add new ground seed points to the blank grid
Fig. 7. Diagram of distance from point to fitted plane
Fig. 8. Point cloud data filtering results. (a) DSM of raw data; (b) true DEM; (c) DEM of the filtering results of the proposed method; (d) error distribution of filtering results of the proposed method
Fig. 9. Comparison of total errors of the five methods
Fig. 10. Comparison of mean values of the three kinds of error of the five methods
Fig. 11. Average total errors of different verticality thresholds
Fig. 12. Average total errors of different height difference thresholds
Fig. 13. Average total errors of different distance thresholds
|
Table 1. 15 groups of point cloud data and their characteristics
| |||||||||||||
Table 2. Error matrix
|
Table 3. Filtering error of 15 experiment data of the proposed method

Set citation alerts for the article
Please enter your email address
© Copyright 2018-2021 | Chinese Laser Press. All Rights Reserved 沪ICP备15018463号-20