
Jian Liu, Ka-Di Zhu, "Coupled quantum molecular cavity optomechanics with surface plasmon enhancement," Photonics Res. 5, 450 (2017)
- Photonics Research
- Vol. 5, Issue 5, 450 (2017)
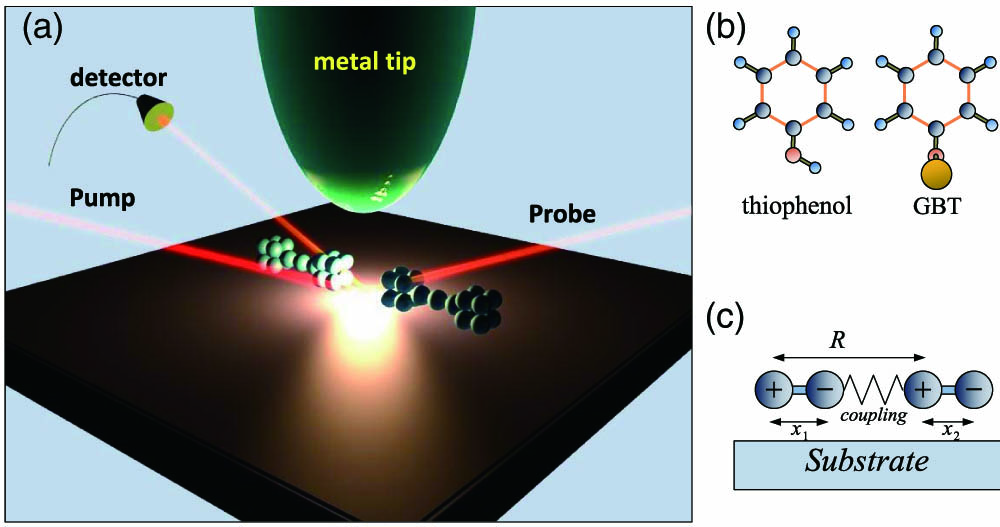
Fig. 1. (a) Diagram of surface plasmon cavity optomechanical system driven by a strong pump laser and probed by a weak signal laser. The double molecules reside on the substrate. (b) Molecules of thiophenol and GBT in their lowest energy conformations. (c) Interacting molecules with R x 1 x 2
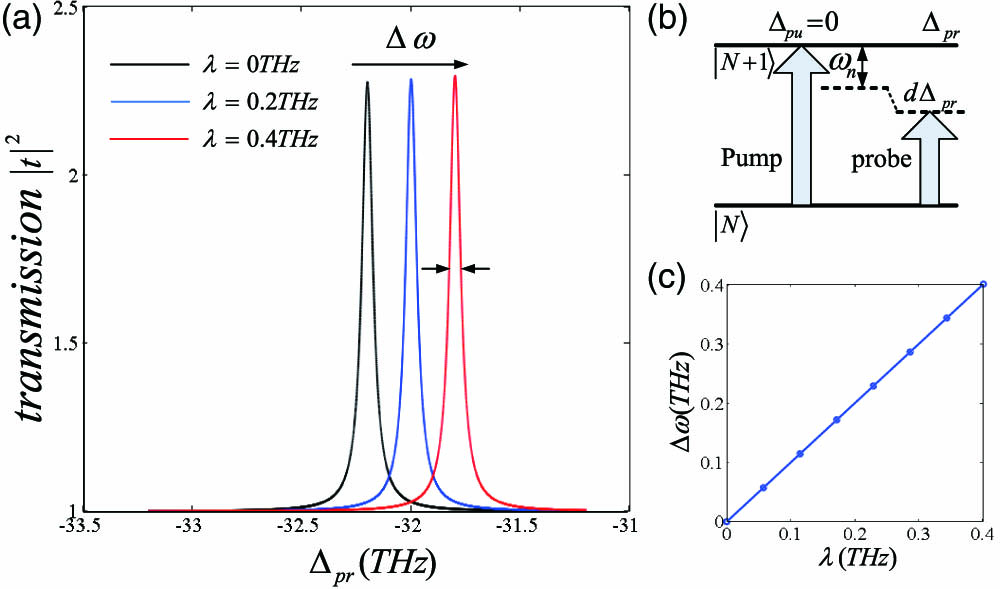
Fig. 2. (a) Transmission spectrum of the probe beam as a function of the probe–pump detuning with different van der Waals coupling rates for the same molecules (GBT). We choose λ = 0 , 0.2 , and 0.4 THz Δ p = 0 Ω pu 2 = 0.22 eV 2 ω 1 = ω 2 = 32.2 THz g 1 = g 2 = 70 GHz κ / ( 2 π ) = 33 THz γ 1 , 2 / ( 2 π ) = 0.06 THz
Fig. 3. (a) Transmission spectrum of the probe beam as a function of the probe–pump detuning with various van der Waals coupling rates for different two molecules (thiophenol and GBT). We choose λ = 0 , 0.1 , and 0.4 THz Δ p = 0 Ω pu 2 = 0.22 eV 2 ω 1 = 32.1 THz ω 2 = 32.2 THz g 1 = 4.7 GHz g 2 = 70 GHz κ / ( 2 π ) = 33 THz γ 1 , 2 / ( 2 π ) = 0.06 THz D λ
Fig. 4. Transmission and reflection spectrum of a signal beam with different range between molecules (thiophenol and GBT) in the case of Ω pu 2 = 0.09 eV 2 2 .


Set citation alerts for the article
Please enter your email address

© Copyright 2018-2021 | Chinese Laser Press. All Rights Reserved 沪ICP备15018463号-20