• Opto-Electronic Advances
  • Vol. 3, Issue 5, 190035-1 (2020)
Nikolaos Livakas1、2, Evangelos Skoulas1、2, and Emmanuel Stratakis1、3、*
Author Affiliations
  • 1Institute of Electronic Structure and Laser, Foundation for Research and Technology-Hellas, Heraklion Crete 71110, Greece
  • 2Department of Materials Science and Technology, University of Crete, Heraklion Crete 71003, Greece
  • 3Department of Physics, University of Crete, Heraklion Crete 71003, Greece
  • show less
    DOI: 10.29026/oea.2020.190035 Cite this Article
    Nikolaos Livakas, Evangelos Skoulas, Emmanuel Stratakis. Omnidirectional iridescence via cylindrically-polarized femtosecond laser processing[J]. Opto-Electronic Advances, 2020, 3(5): 190035-1 Copy Citation Text show less
    The experimental setup used for surface structuring.The laser fluence was tuned via the use of a λ/2 waveplate (HW) and a linear polarizer (LP). Laser source emits a Gaussian linearly polarized beam, which is transformed to a CV radially polarized beam by means of an s-waveplate (SW). Large areas were produced via translation of the sample in the x-y-z directions.
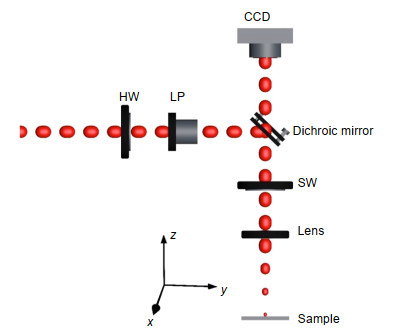
    Fig. 1. The experimental setup used for surface structuring.The laser fluence was tuned via the use of a λ/2 waveplate (HW) and a linear polarizer (LP). Laser source emits a Gaussian linearly polarized beam, which is transformed to a CV radially polarized beam by means of an s-waveplate (SW). Large areas were produced via translation of the sample in the x-y-z directions.
    LSFL periodicity dependence on the laser fluence (a), and the effective number of pulses (b), for linearly (squares) and radially (circles) polarized fs beams. Top-view SEM images of areas produced upon irradiation using linearly (c, d) and radially (e, f) polarized fs beams.The images shown in (c) and (e) correspond to non-uniform areas, whereas those in (d) and (f) to areas obtained using optimized irradiation conditions. The red arrows depict the electric field polarization state. The 2D-FFT patterns corresponding to each area are shown.
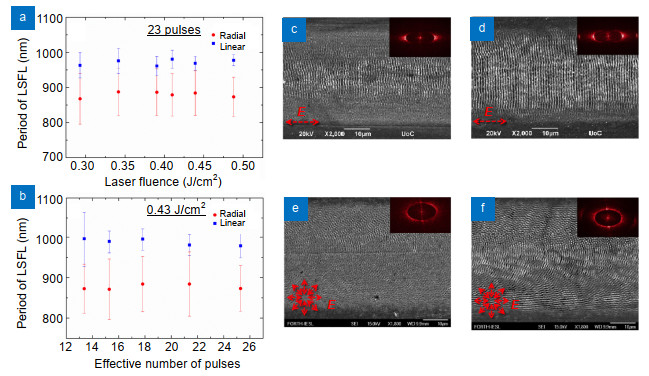
    Fig. 2. LSFL periodicity dependence on the laser fluence (a), and the effective number of pulses (b), for linearly (squares) and radially (circles) polarized fs beams. Top-view SEM images of areas produced upon irradiation using linearly (c, d) and radially (e, f) polarized fs beams.The images shown in (c) and (e) correspond to non-uniform areas, whereas those in (d) and (f) to areas obtained using optimized irradiation conditions. The red arrows depict the electric field polarization state. The 2D-FFT patterns corresponding to each area are shown.
    Top-view SEM images of areas produced upon irradiation using linearly (a–c) and radially (d–f) polarized fs beams.The images shown in (b, c) and (e, f) are higher magnifications of the images (a, d) respectively. The areas in (a–c) were fabricated at F=0.45 J/cm2 and Neff-area=36, δ=32 μm, and v=2 mm/s, while those in (d–f) were obtained at F=0.49 J/cm2, Neff-area=30, δ=34 μm, and v=2 mm/s. The red arrows depict the electric field polarization state. The 2D-FFT patterns corresponding to each area are shown in the insets.
    Fig. 3. Top-view SEM images of areas produced upon irradiation using linearly (a–c) and radially (d–f) polarized fs beams.The images shown in (b, c) and (e, f) are higher magnifications of the images (a, d) respectively. The areas in (a–c) were fabricated at F=0.45 J/cm2 and Neff-area=36, δ=32 μm, and v=2 mm/s, while those in (d–f) were obtained at F=0.49 J/cm2, Neff-area=30, δ=34 μm, and v=2 mm/s. The red arrows depict the electric field polarization state. The 2D-FFT patterns corresponding to each area are shown in the insets.
    (a) Experimental setup and geometry used for the evaluation of surface diffraction properties. (b) Typical intensity plot of the white light spectrum. (c) Schematic illustration of the structural color monitoring system. (d) The respective coordination parameters.
    Fig. 4. (a) Experimental setup and geometry used for the evaluation of surface diffraction properties. (b) Typical intensity plot of the white light spectrum. (c) Schematic illustration of the structural color monitoring system. (d) The respective coordination parameters.
    Schematic illustration of the structural colors observed the S1 (a) and the S2 (b) sample series respectively; 2D-FFT patterns corresponding to the S1 (c) and the S2 (e) sample series respectively. The corresponding intensity plots of the 2D-FFT patterns in four different directions (denoted as '1' to '4') are depicted in (d) and (f) respectively.Inset in (f) displays the periodicity values of LSFL structures for a series of four cross-sections taken in the Fourier image of the S2 surface.
    Fig. 5. Schematic illustration of the structural colors observed the S1 (a) and the S2 (b) sample series respectively; 2D-FFT patterns corresponding to the S1 (c) and the S2 (e) sample series respectively. The corresponding intensity plots of the 2D-FFT patterns in four different directions (denoted as '1' to '4') are depicted in (d) and (f) respectively.Inset in (f) displays the periodicity values of LSFL structures for a series of four cross-sections taken in the Fourier image of the S2 surface.
    (a) Diffracted colors of S1 surfaces obtained upon irradiation with linearly polarized fs beam. (b) Diffracted colors of S2 surfaces obtained upon irradiation with radially polarized fs beam. Each color is characterized by the coordinates (ω, φ+θ, β), as defined by the optical system used for their monitoring.
    Fig. 6. (a) Diffracted colors of S1 surfaces obtained upon irradiation with linearly polarized fs beam. (b) Diffracted colors of S2 surfaces obtained upon irradiation with radially polarized fs beam. Each color is characterized by the coordinates (ω, φ+θ, β), as defined by the optical system used for their monitoring.
    Nikolaos Livakas, Evangelos Skoulas, Emmanuel Stratakis. Omnidirectional iridescence via cylindrically-polarized femtosecond laser processing[J]. Opto-Electronic Advances, 2020, 3(5): 190035-1
    Download Citation