
Junning Cui, Wei Li, Xingyuan Bian, Gang Zhu, Zhangqiang He, Limin Zou. Homodyne quadrature laser interferometry measurement method for large amplitude, long cycle vibration calibration[J]. Infrared and Laser Engineering, 2021, 50(6): 20200329
- Infrared and Laser Engineering
- Vol. 50, Issue 6, 20200329 (2021)
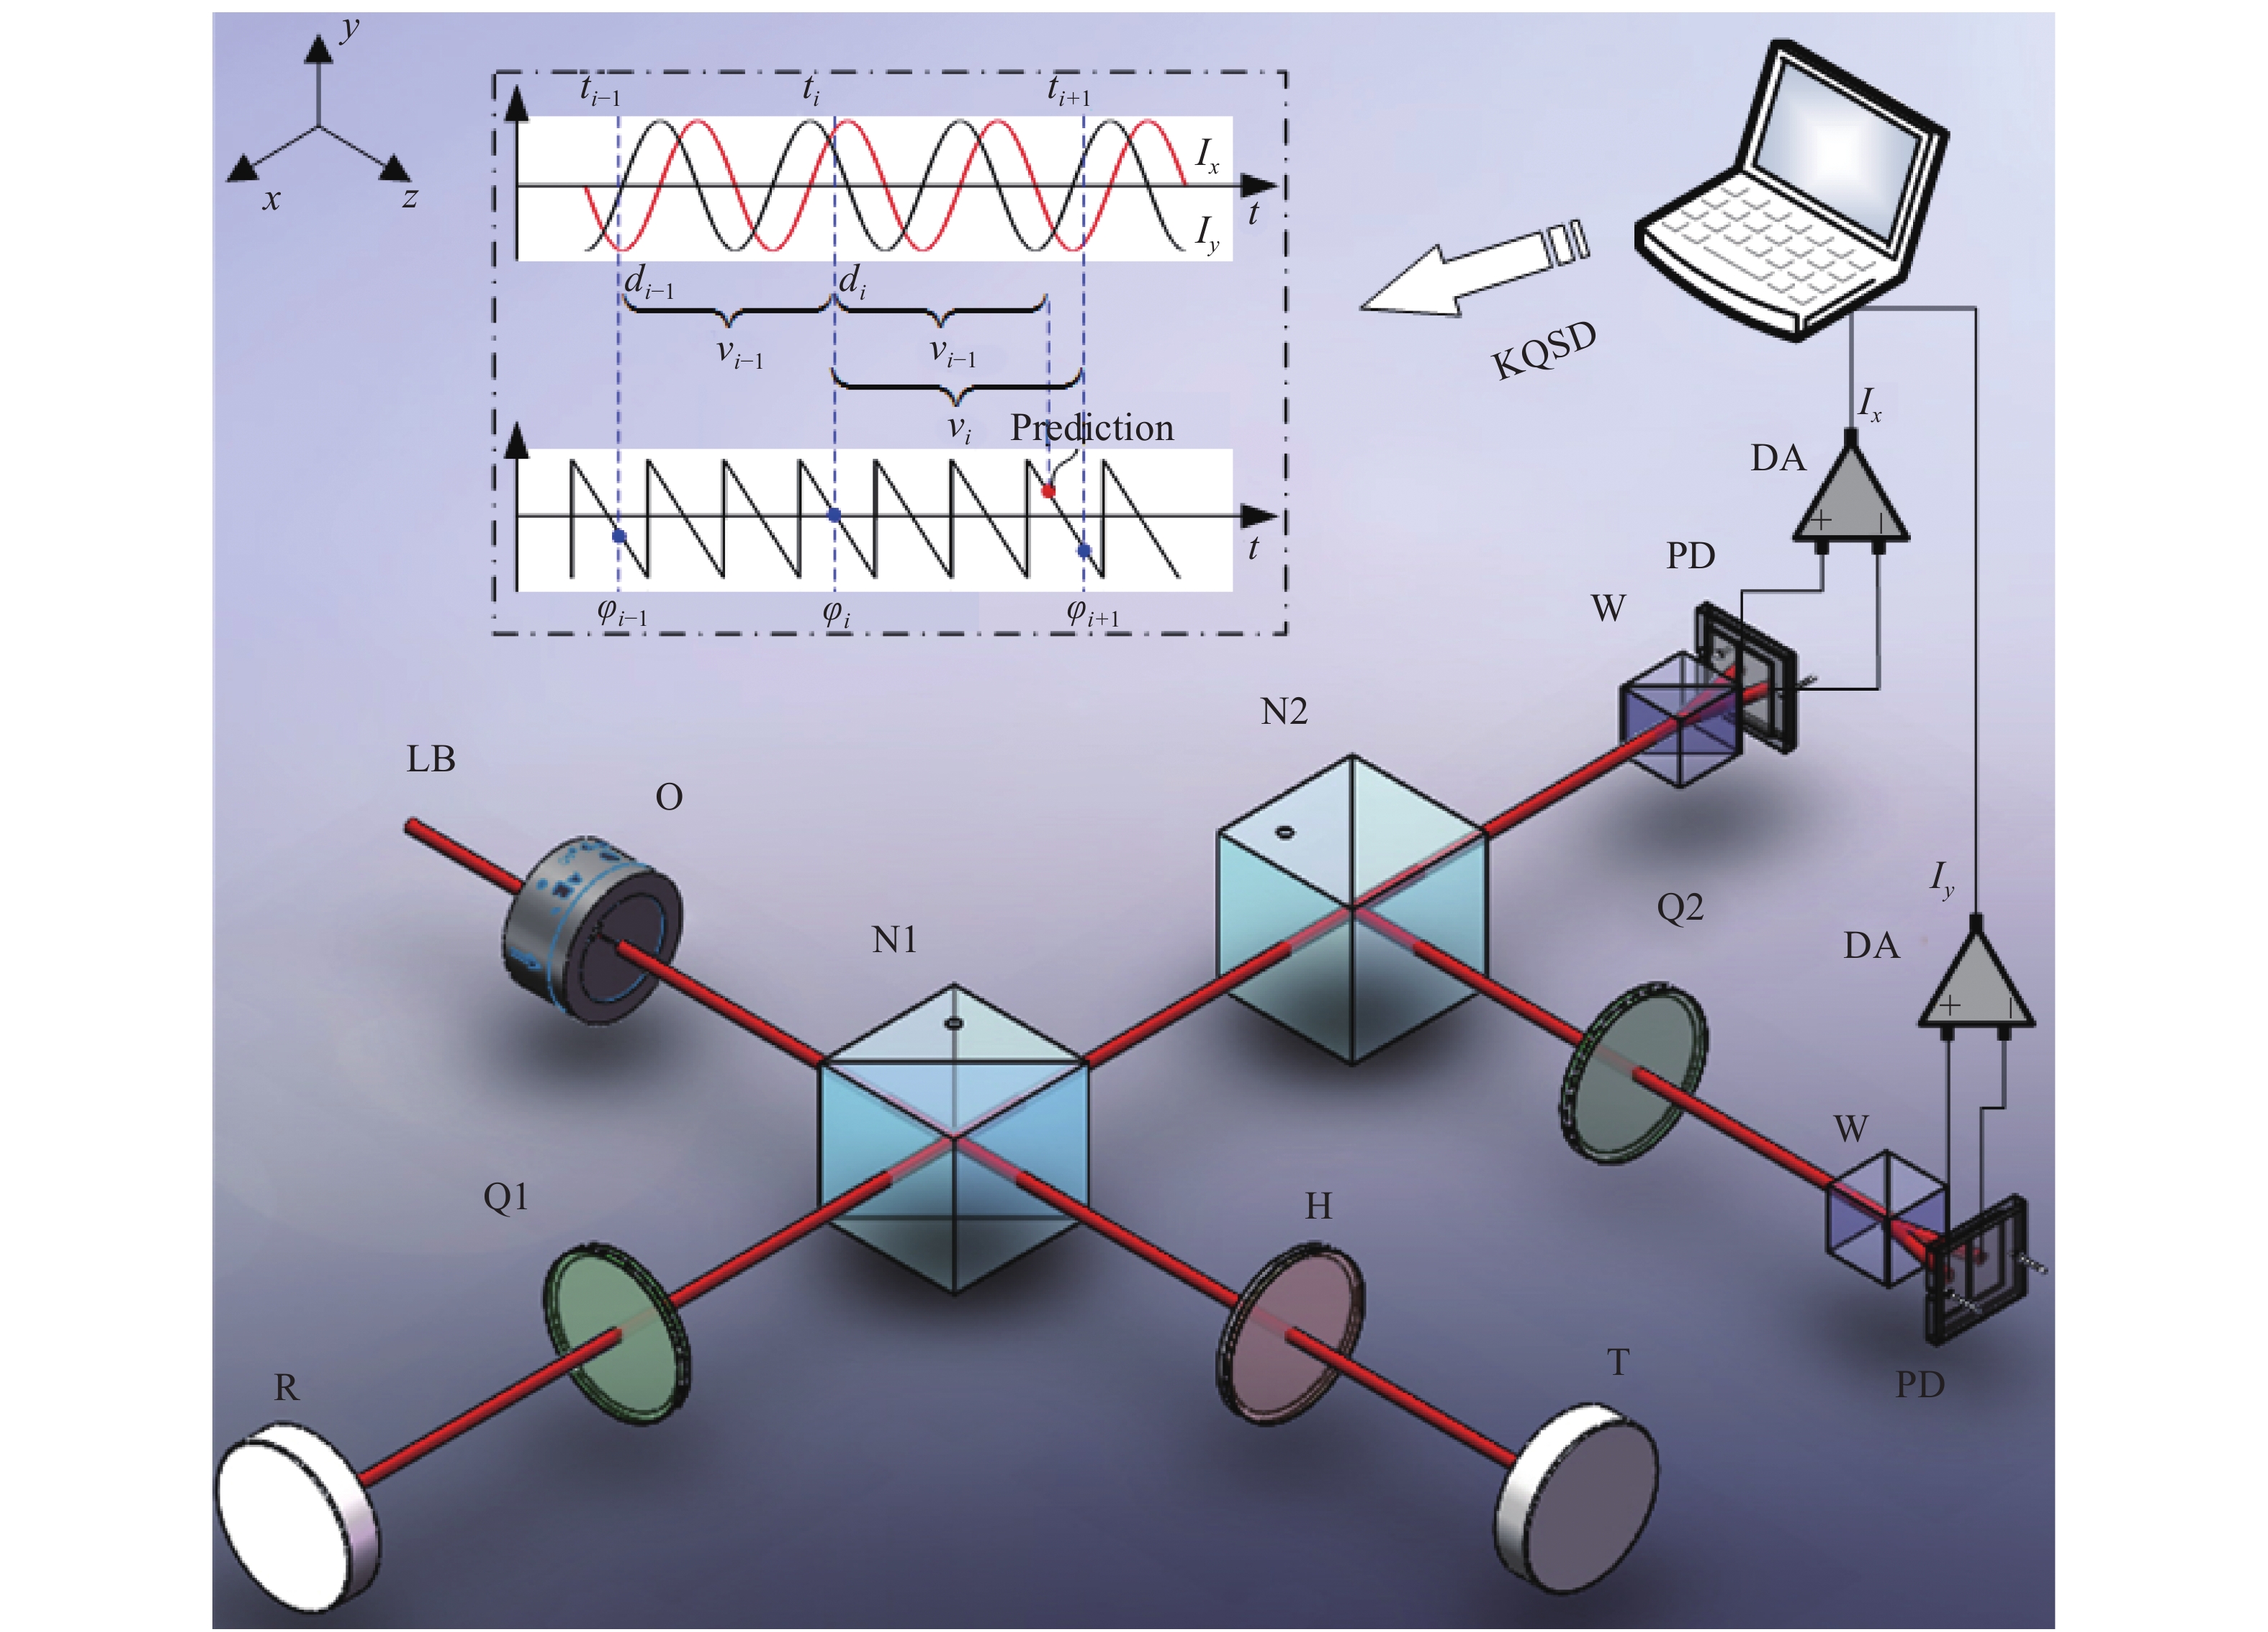
Fig. 1. Schematic diagram of undersampling homodyne quadrature interferometry measurement method. LB, Laser beam;O, Optical Faraday isolator;N1, Non-polarizing beam splitters 1;N2, Non-polarizing beam splitters 2;Q1, Quarter-wave plate 1;Q2, Quarter-wave plate 2;W, Wollaster prism;H, Half-wave plate;R, Reference mirror;T, Target mirror;PD, Photodetector;DA, Differential amplifier;KQSD, Kalman quadrature signal demodulation
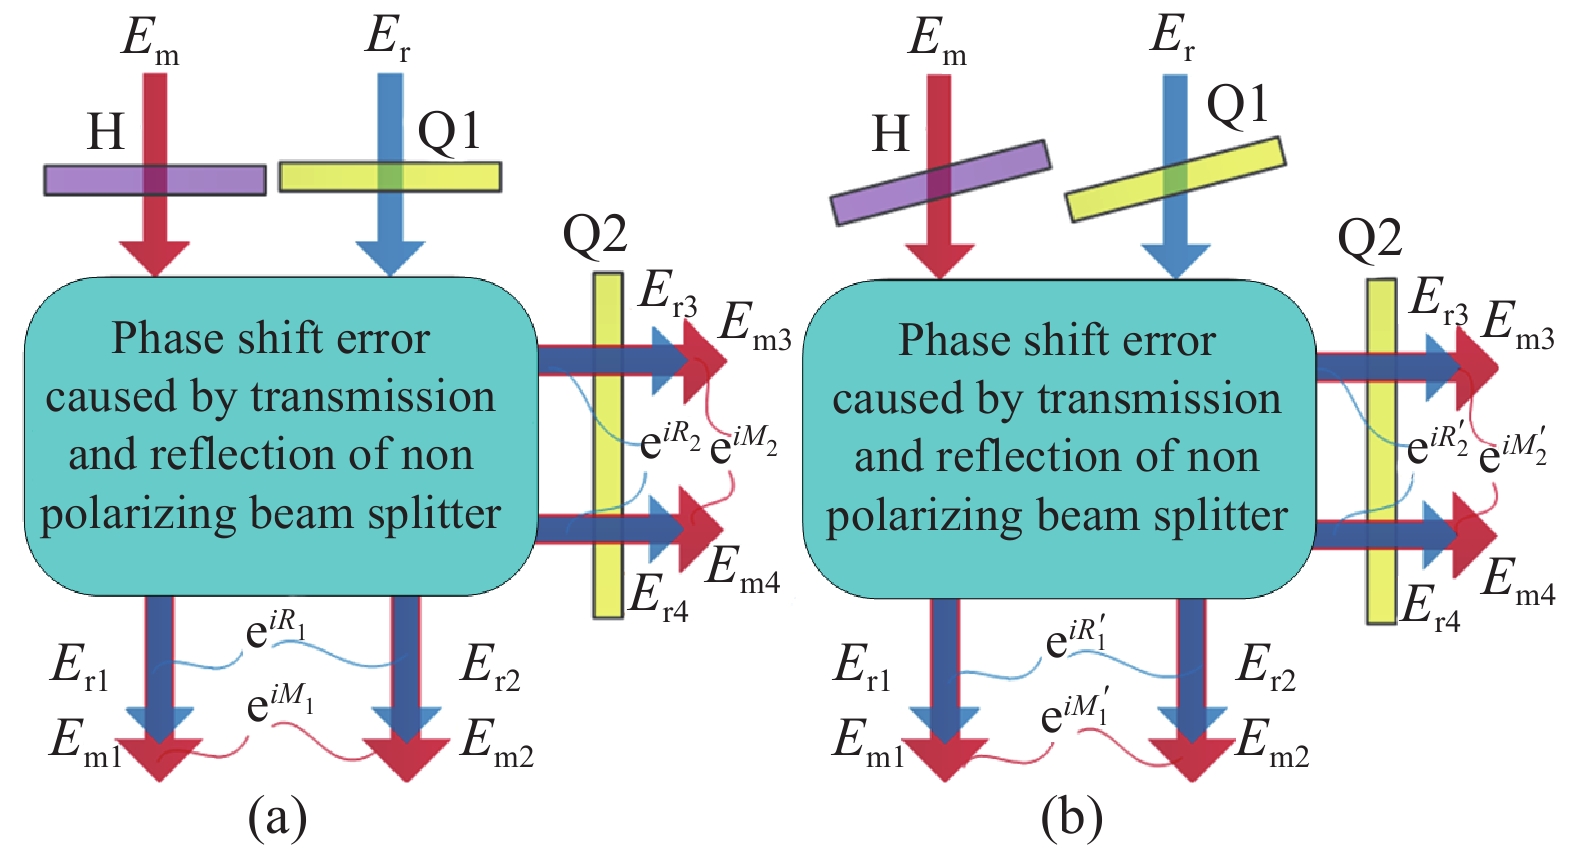
Fig. 2. (a) Normal beam incident to wave plates; (b) Non quadrature phase error compensation by yawing wave plates
Fig. 3. Simulation results of non quadrature phase error introduced by angle deviations of wave plates
Fig. 4. Simulation results of non quadrature phase error sensitivities to angle deviations of wave plates
Fig. 5. Experimental setup of undersampling homodyne quadrature interferometry measurement method
Fig. 6. Experimental results of quadrature phase error vs. optical axis angles of wave plate
Fig. 7. Experimental results of nonlinear error varying with the assembling angle of wave plate
Fig. 8. Relation curve between a max and vibration frequency
Fig. 9. Sampling rate vs. vibration frequency
Fig. 10. The sampling numbers of interference fringe as a function of vibration frequency in low frequency vibration
Fig. 11. Residual error between demodulation vibration signal and the standard sinusoidal vibration for 0.01 Hz

Set citation alerts for the article
Please enter your email address
© Copyright 2018-2021 | Chinese Laser Press. All Rights Reserved 沪ICP备15018463号-20