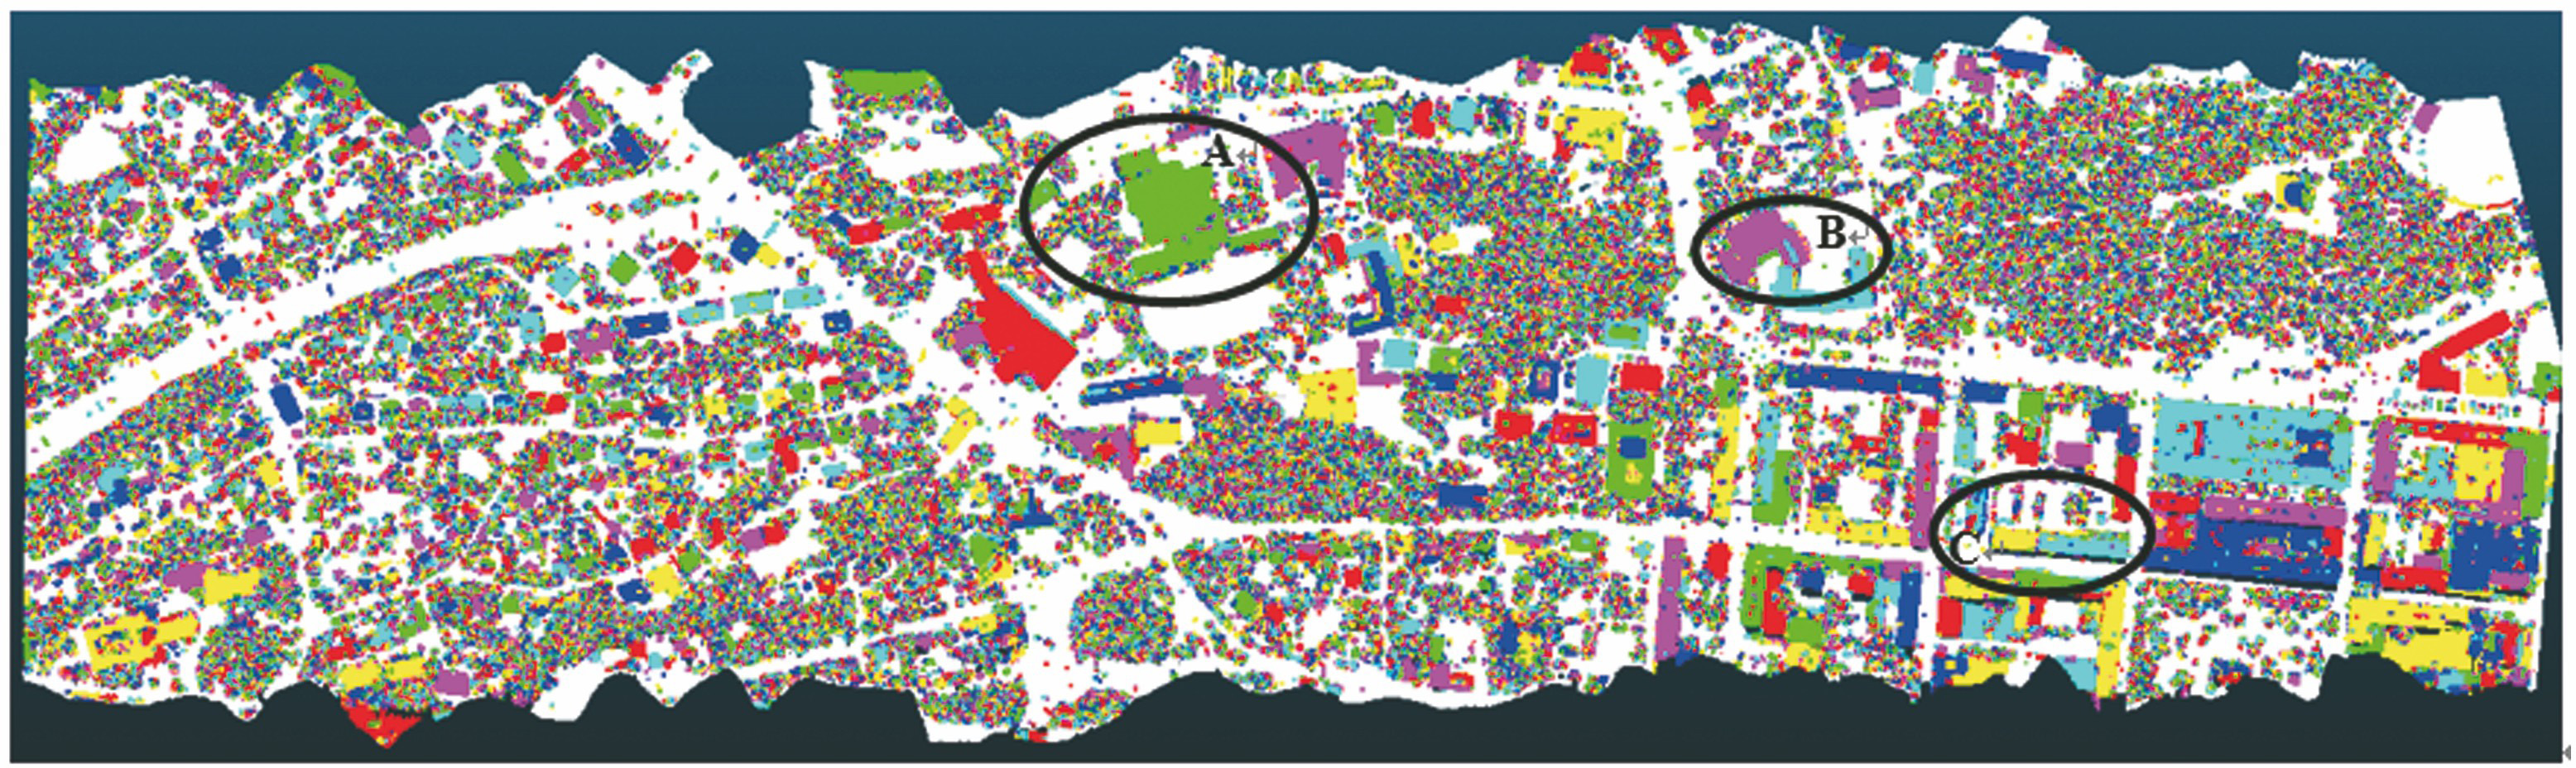
Fig. 1. An example of point cloud multi-factor segmentation based on traditional RG algorithm
Fig. 2. An example of point cloud multi-factor segmentation based on MRG algorithm
Fig. 3. An example of normal vector. (a) Point cloud; (b) normal vector of point cloud
Fig. 4. An example of linear and planar point set segmentation. (a) Linear point set; (b) planar point set
Fig. 5. Schematic diagram of threshold vt setting
Fig. 6. An example of volume change based on correct merging (ΔV=2.13). (a) Unmerged segments; (b) convex hulls of unmerged segments; (c) merged segment; (d) convex hull of merged segments
Fig. 7. An example of volume change based on incorrect merging (ΔV=17214.04). (a) Unmerged segments; (b) convex hulls of unmerged segments; (c) merged segment; (d) convex hull of merged segments
Fig. 8. Pseudo-code of merge strategy
Fig. 9. Point cloud data set. (a) Airborne point cloud (scene I); (b) terrestrial point cloud (scene II); (c) vehicle-borne point cloud (scene III)
Fig. 10. Reference data of each scene. (a) Scene I; (b) scene II; (c) scene III
Fig. 11. Segmentation results of planar point set in Scene II and Scene III (Nt=15°). (a) MRG in Scene II; (b) IMRG in Scene II; (c) MRG in Scene III; (d) IMRG in Scene III
Fig. 12. Incorrect segmentation. (a) RG+mean shift; (b) CSF+DBSCAN; (c) GMIC
Method | TP | FP |
---|
RG+mean shift | 351708 | 29669 | CSF+DBSCAN | 364594 | 34771 | IMRG | 340502 | 38946 |
|
Table 1. 1 Segmentation results of ground in Scene I
Method | Nt /(°) | P /% | R /% | F1 /% |
---|
Scene I | Scene II | Scene III | Scene I | Scene II | Scene III | Scene I | Scene II | Scene III |
---|
| 5 | 97.38 | 99.23 | 99.40 | 84.96 | 99.06 | 99.14 | 90.75 | 99.15 | 99.27 | MRG | 10 | 97.32 | 99.40 | 99.34 | 77.80 | 97.41 | 75.80 | 86.47 | 98.40 | 85.99 | | 15 | 93.80 | 72.38 | 99.41 | 68.09 | 99.90 | 34.56 | 78.91 | 83.94 | 51.29 | | 5 | 97.56 | 99.33 | 99.45 | 87.68 | 99.00 | 99.25 | 92.35 | 99.16 | 99.35 | IMRG | 10 | 97.50 | 99.41 | 99.52 | 90.94 | 98.96 | 88.12 | 94.11 | 99.19 | 93.48 | | 15 | 97.23 | 99.43 | 99.38 | 89.91 | 96.91 | 64.50 | 93.43 | 98.16 | 78.23 |
|
Table 1. Segmentation evaluation of building plane in each scene
Method | F1 /% | Time /s |
---|
Building plan | Ground | Vegetation | Car | |
---|
Method 1 | 98.56 | 98.19 | 98.41 | 93.89 | 954.01 | Method 2 | 97.52 | 98.69 | 97.01 | 92.72 | 1750.89 | Method 3 | 93.08 | 96.18 | 89.58 | 82.65 | 1218.09 | Method 4 | 99.01 | 98.71 | 98.90 | 95.39 | 987.68 | Method 5 | 91.92 | 96.10 | 89.47 | 79.11 | 5922.04 |
|
Table 1. 0 F1 score of segmentation in Scene III
Method | Nt /(°) | P /% | R /% | F1 /% |
---|
Scene I | Scene II | Scene III | Scene I | Scene II | Scene III | Scene I | Scene II | Scene III |
---|
| 5 | 88.41 | 97.64 | 98.61 | 87.87 | 98.09 | 99.03 | 88.14 | 97.87 | 98.82 | MRG | 10 | 85.78 | 93.77 | 84.42 | 90.65 | 98.55 | 99.31 | 88.15 | 96.10 | 91.26 | | 15 | 83.09 | 93.65 | 67.05 | 90.55 | 3.66 | 99.54 | 86.66 | 7.05 | 80.13 | | 5 | 90.11 | 97.51 | 98.75 | 86.23 | 98.34 | 99.07 | 88.13 | 97.92 | 98.91 | IMRG | 10 | 89.85 | 97.39 | 91.50 | 89.81 | 98.56 | 99.31 | 89.83 | 97.97 | 95.25 | | 15 | 89.27 | 92.66 | 78.99 | 90.58 | 98.63 | 99.45 | 89.92 | 95.55 | 88.05 |
|
Table 2. Segmentation evaluation of ground in each scene
Scene | dt /m | st /m | Vt |
---|
Scene I | 1.54 | 0.40 | 18.71 | Scene II | 0.25 | 0.05 | 16.33 | Scene III | 0.13 | 0.03 | 14.61 |
|
Table 3. Merge threshold parameters
Type of ground object | Building plan | Ground | Vegetation |
---|
| P /% | 89.70 | 87.53 | 91.77 | Strategy① (M=1150) | R /% | 80.50 | 87.92 | 92.14 | | F1 /% | 84.85 | 87.72 | 91.96 | | P /% | 96.44 | 89.74 | 92.99 | Strategy② (M=1515) | R /% | 90.43 | 89.19 | 94.14 | | F1 /% | 93.34 | 89.46 | 93.56 |
|
Table 4. Merge results in Scene I
Type of ground object | Building plan | Ground | Vegetation | Power line |
---|
| P /% | 97.67 | 91.15 | 99.78 | 95.72 | Strategy①(M=1550) | R /% | 96.22 | 97.25 | 96.47 | 60.97 | | F1 /% | 96.94 | 94.10 | 98.10 | 74.49 | | P /% | 99.38 | 97.42 | 99.78 | 99.40 | Strategy②(M=2730) | R /% | 98.97 | 98.45 | 99.79 | 98.36 | | F1 /% | 99.17 | 97.94 | 99.79 | 98.88 |
|
Table 5. Merge results in Scene II
Type of ground object | Building plan | Ground | Vegetation | Car |
---|
| P /% | 97.09 | 98.30 | 98.75 | 94.67 | Strategy①(M=1673) | R /% | 98.65 | 98.18 | 96.40 | 94.14 | | F1 /% | 97.86 | 98.24 | 97.56 | 94.41 | | P /% | 98.96 | 98.72 | 99.01 | 95.35 | Strategy②(M=2386) | R /% | 99.07 | 98.71 | 98.79 | 95.44 | | F1 /% | 99.01 | 98.71 | 98.90 | 95.39 |
|
Table 6. Merge results in Scene III
Scene | CSF | DBSCAN |
---|
lc /m | hc /m | rd /m | md |
---|
Scene I | 0.8 | 0.5 | 2 | 5 | Scene II | 2 | 0.4 | 0.5 | 10 | Scene III | 2 | 0.5 | 0.5 | 30 |
|
Table 7. Parameters for Method 4
Method | F1 /% | Time /s |
---|
Buildingplan | Ground | Vegetation |
---|
Method 1 | 76.84 | 85.03 | 90.62 | 294.03 | Method 2 | 92.99 | 92.17 | 94.71 | 4697.64 | Method 3 | 83.70 | 93.35 | 94.42 | 3230.18 | Method 4 | 93.34 | 89.46 | 93.56 | 372.53 |
|
Table 8. F1 score of segmentation in Scene I
Method | F1 /% | Time /s |
---|
Building plan | Ground | Vegetation | Power line | |
---|
Method 1 | 97.00 | 94.56 | 97.53 | 54.95 | 499.06 | Method 2 | 98.94 | 97.57 | 98.74 | 93.61 | 943.72 | Method 3 | 98.64 | 97.51 | 99.19 | 79.06 | 1523.06 | Method 4 | 99.17 | 97.94 | 99.79 | 98.88 | 830.65 | Method 5 | 97.90 | 95.71 | 96.36 | 78.59 | 4627.44 |
|
Table 9. F1 score of segmentation in Scene II