• Laser & Optoelectronics Progress
  • Vol. 58, Issue 16, 1611001 (2021)
Liwen Li1、**, Zhongcheng Liang1、*, Rui Zhao1, Jianfei Guan1, Meimei Kong1, Tao Chen1, and Yue Zhang2
Author Affiliations
  • 1College of Electronic and Optical Engineering & College of Microelectronics, Nanjing University of Posts and Telecommunications, Nanjing, Jiangsu 210023, China;
  • 2Beijing Institute of Space Mechanics and Electricity, China Academy of Space Technology, Beijing 100094, China
  • show less
    DOI: 10.3788/LOP202158.1611001 Cite this Article Set citation alerts
    Liwen Li, Zhongcheng Liang, Rui Zhao, Jianfei Guan, Meimei Kong, Tao Chen, Yue Zhang. Optimization of Multiobjective Simulated Annealing Array for Optical Synthetic Aperture[J]. Laser & Optoelectronics Progress, 2021, 58(16): 1611001 Copy Citation Text show less
    Two classic array structures. (a) Golay6 array; (b) Golay9 array
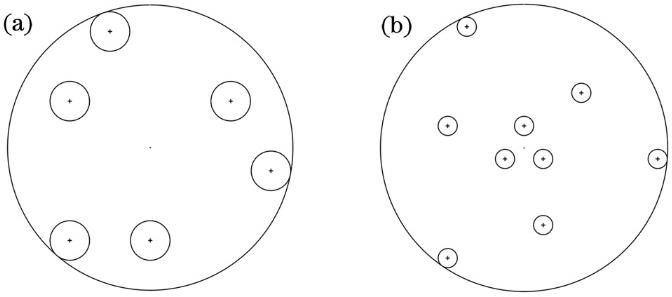
    Fig. 1. Two classic array structures. (a) Golay6 array; (b) Golay9 array
    MTF curves of Golay6 under different filling factors. (a) fx direction; (b) fy direction
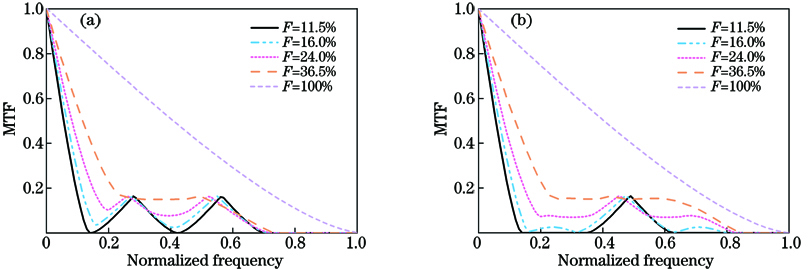
    Fig. 2. MTF curves of Golay6 under different filling factors. (a) fx direction; (b) fy direction
    Desired MTF curve of the Golay6 array structure. (a) fx direction; (b) fy direction
    Fig. 3. Desired MTF curve of the Golay6 array structure. (a) fx direction; (b) fy direction
    Array structure before and after optimization. (a) Initial structure; (b) optimized structure
    Fig. 4. Array structure before and after optimization. (a) Initial structure; (b) optimized structure
    MTF of the array structure before and after optimization. (a) MTF of the initial array structure; (b) MTF of the optimized array structure; (c) top view of the initial array structure; (d) top view of the optimized array structure
    Fig. 5. MTF of the array structure before and after optimization. (a) MTF of the initial array structure; (b) MTF of the optimized array structure; (c) top view of the initial array structure; (d) top view of the optimized array structure
    MTF curve of the array structure in logarithmic coordinate system. (a) fx direction; (b) fy direction
    Fig. 6. MTF curve of the array structure in logarithmic coordinate system. (a) fx direction; (b) fy direction
    Imaging results of different structures. (a) Original test card; (b) initial aperture array; (c) optimized aperture array
    Fig. 7. Imaging results of different structures. (a) Original test card; (b) initial aperture array; (c) optimized aperture array
    Simulated image and MTF of the array in the fx direction before and after optimization. (a) Simulated image of the Golay6; (b) simulated image after optimization; (c) MTF of the array before and after optimization
    Fig. 8. Simulated image and MTF of the array in the fx direction before and after optimization. (a) Simulated image of the Golay6; (b) simulated image after optimization; (c) MTF of the array before and after optimization
    Simulated image and MTF of the array in the fy direction before and after optimization. (a) Simulated image of the Golay6; (b) simulated image after optimization; (c) MTF of the array before and after optimization
    Fig. 9. Simulated image and MTF of the array in the fy direction before and after optimization. (a) Simulated image of the Golay6; (b) simulated image after optimization; (c) MTF of the array before and after optimization
    MTF curve of the array structure before and after optimization (F=11.5%). (a) fx direction; (b) fy direction; (c) π/4 direction of x axis
    Fig. 10. MTF curve of the array structure before and after optimization (F=11.5%). (a) fx direction; (b) fy direction; (c) π/4 direction of x axis
    MTF curve of the array structure before and after optimization (F=13.0%). (a) fx direction; (b) fy direction; (c) π/4 directionn direction of x axis
    Fig. 11. MTF curve of the array structure before and after optimization (F=13.0%). (a) fx direction; (b) fy direction; (c) π/4 directionn direction of x axis
    Array structure obtained by different α. (a) α=0.91; (b) α=0.94; (c) α=0.97
    Fig. 12. Array structure obtained by different α. (a) α=0.91; (b) α=0.94; (c) α=0.97
    MTF of the array structure with different α . (a) α=0.91; (b) α=0.94; (c) α=0.97
    Fig. 13. MTF of the array structure with different α . (a) α=0.91; (b) α=0.94; (c) α=0.97
    Objective functionJxJyJ̅
    Initial value0.33820.31680.3275
    Final value0.02880.02760.0282
    γ /%8.528.718.61
    Table 1. Objective function values of the array structure before and after optimization
    αJxJyγ̅ /%
    0.910.06760.066720.50
    0.940.04910.047814.79
    0.970.02880.02768.61
    Table 2. Objective function value of the optimized array structure under different α
    Liwen Li, Zhongcheng Liang, Rui Zhao, Jianfei Guan, Meimei Kong, Tao Chen, Yue Zhang. Optimization of Multiobjective Simulated Annealing Array for Optical Synthetic Aperture[J]. Laser & Optoelectronics Progress, 2021, 58(16): 1611001
    Download Citation