
Zhiyuan Gu, Xianghui Wang, Jianxin Wang, Fei Fan, Shengjiang Chang. Sidelobe suppression and axial resolution enhancement in 4pi microscopy with higher-order radially polarized Laguerre–Gaussian beams using subtractive imaging[J]. Chinese Optics Letters, 2019, 17(12): 121103
- Chinese Optics Letters
- Vol. 17, Issue 12, 121103 (2019)
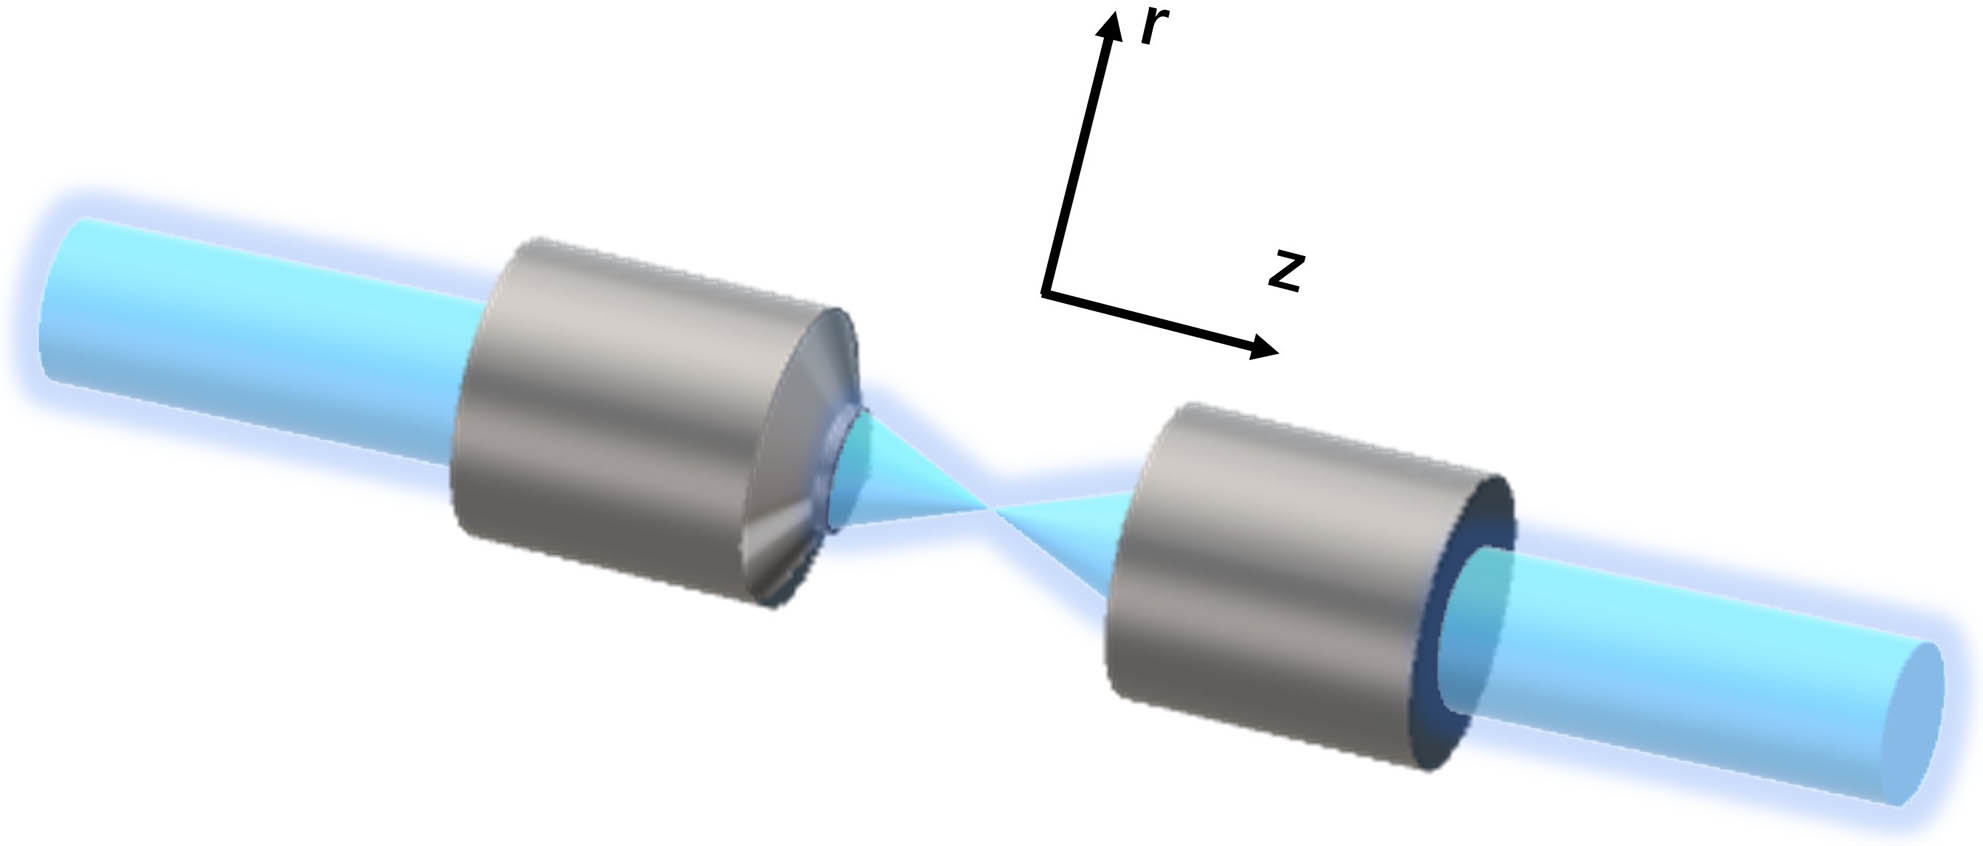
Fig. 1. Diagram of 4pi focusing configuration. The lateral and axial directions are denoted by the
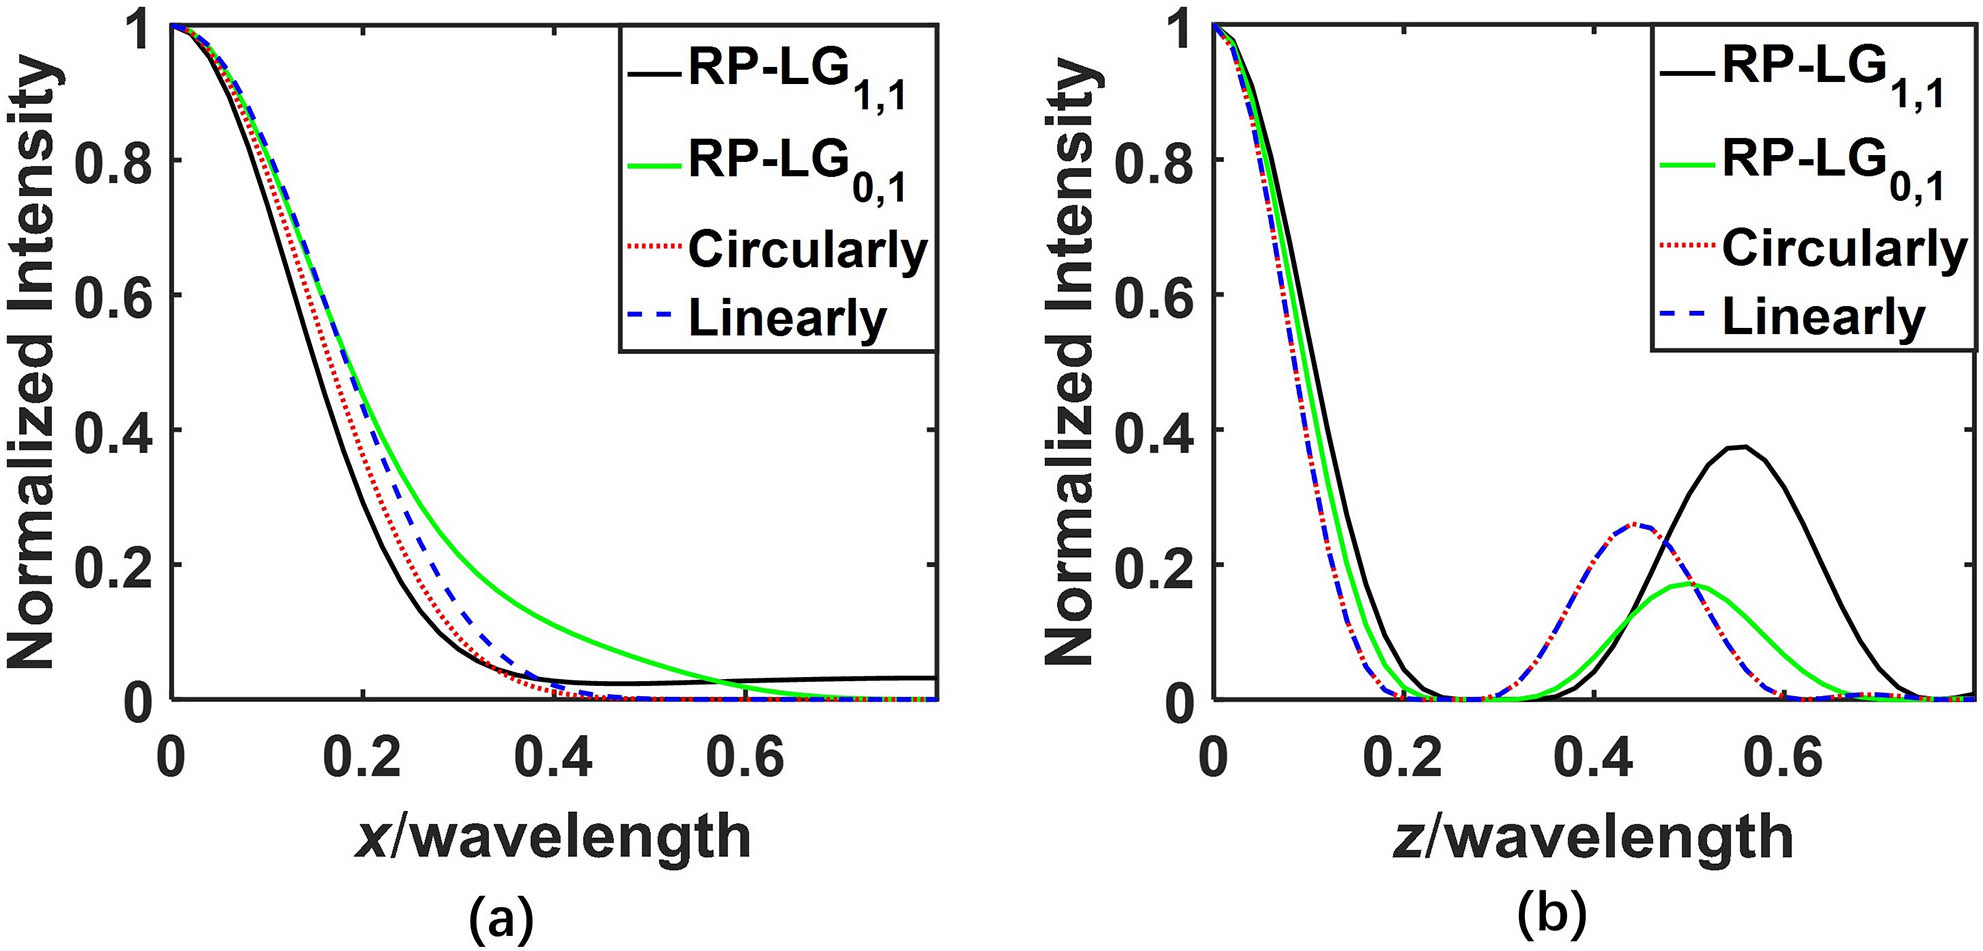
Fig. 2. Calculated PSF profiles (a) in the transverse direction and (b) in the axial direction for the
Fig. 3. 2D intensity distributions of the (a)
Fig. 4. Corresponding axial OTFs calculated for the
Fig. 5. Transverse intensity distributions in the focal plane when illuminated by (a)
Fig. 6. (a) 3D point array sample. (b) Cross section of the 3D sample in the
Fig. 7. (a) 3D image reconstruction of the point array sample with the

Set citation alerts for the article
Please enter your email address
© Copyright 2018-2021 | Chinese Laser Press. All Rights Reserved 沪ICP备15018463号-20