• Laser & Optoelectronics Progress
  • Vol. 58, Issue 14, 1404002 (2021)
Zhenping Liu*, Rong Jiang, and Kejing Pang
Author Affiliations
  • Chongqing Vocational Institute of Safety & Technology, Chongqing 404020, China
  • show less
    DOI: 10.3788/LOP202158.1404002 Cite this Article Set citation alerts
    Zhenping Liu, Rong Jiang, Kejing Pang. Highly Sensitive Detection of Copper Ions by Reduced Glutathione Modified Gold Nanocluster Fluorescence Sensor[J]. Laser & Optoelectronics Progress, 2021, 58(14): 1404002 Copy Citation Text show less
    Principle of Cu2+ detection by GSH-AuNCs fluorescence sensor
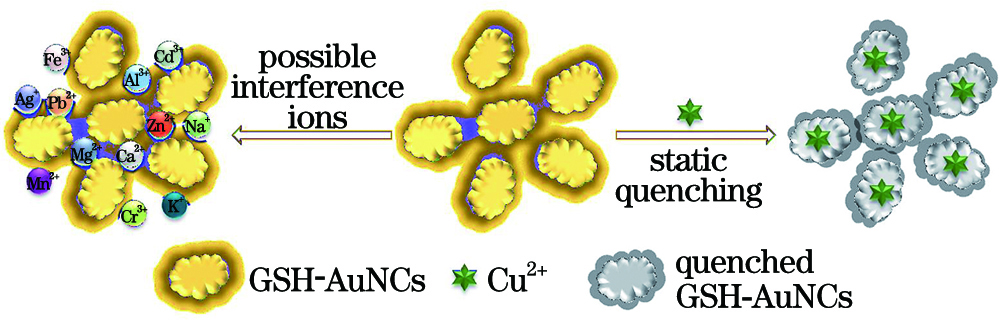
    Fig. 1. Principle of Cu2+ detection by GSH-AuNCs fluorescence sensor
    GSH-AuNCs transmission electron microscope image, illustrated with particle size distribution
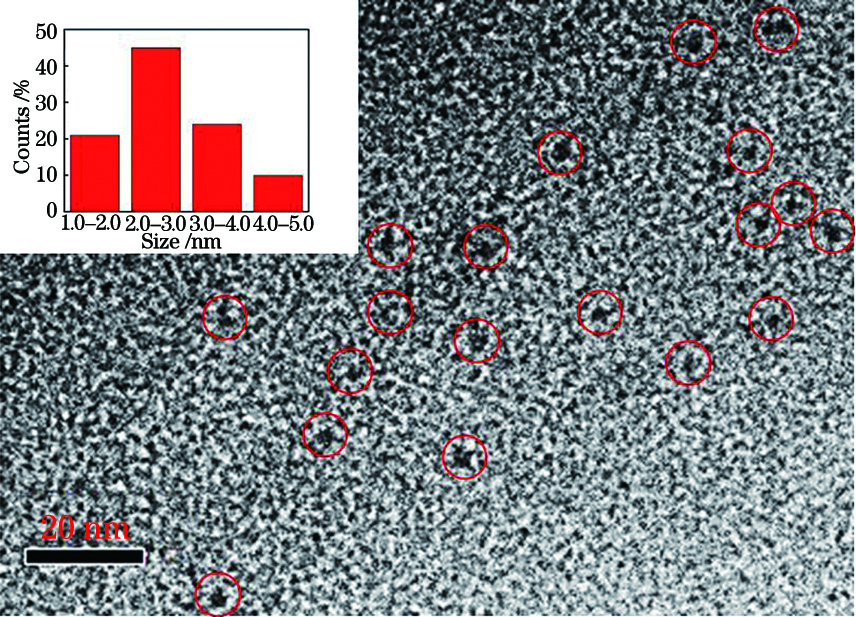
    Fig. 2. GSH-AuNCs transmission electron microscope image, illustrated with particle size distribution
    Infrared spectra of GSH-AuNCs
    Fig. 3. Infrared spectra of GSH-AuNCs
    Fluorescence spectra of GSH-AuNCs
    Fig. 4. Fluorescence spectra of GSH-AuNCs
    Relationship between GSH-AuNCs fluorescence intensity and Cu2+ concentration
    Fig. 5. Relationship between GSH-AuNCs fluorescence intensity and Cu2+ concentration
    Fluorescence attenuation curves of GSH-AuNCs and GSH-AuNCs /Cu2+
    Fig. 6. Fluorescence attenuation curves of GSH-AuNCs and GSH-AuNCs /Cu2+
    Fluorescence emission spectra of GSH-AuNCs under different wavelengths of excitation light
    Fig. 7. Fluorescence emission spectra of GSH-AuNCs under different wavelengths of excitation light
    Effect of pH on fluorescence intensity of GSH-AuNCs
    Fig. 8. Effect of pH on fluorescence intensity of GSH-AuNCs
    Effect of different Cu2+ concentrations on fluorescence intensity of GSH-AuNCs, embedded images a and b are the photos of GSH-AuNCs before and after fluorescence is quenched by Cu2+ under ultraviolet light
    Fig. 9. Effect of different Cu2+ concentrations on fluorescence intensity of GSH-AuNCs, embedded images a and b are the photos of GSH-AuNCs before and after fluorescence is quenched by Cu2+ under ultraviolet light
    Relationship between Cu2+ concentration and natural logarithm of GSH-AuNCs fluorescence intensity ratios before and after quenching
    Fig. 10. Relationship between Cu2+ concentration and natural logarithm of GSH-AuNCs fluorescence intensity ratios before and after quenching
    Specificity analysis of fluorescence sensor
    Fig. 11. Specificity analysis of fluorescence sensor
    MethodLOD /(nmol·L-1)Linear range /(nmol·L-1)Ref.
    Capillary electrophoresis microchip134.0603--15600[49]
    Colorogenic probe of rhodamine B derivative12.0100--6000[50]
    RGO-Au-ZIF-8 electrochemical sensor7.810--10000[51]
    Polypyrrole nanowire electrochemical detection20.020--300[52]
    ICT colorimetric chemosensor37.00--5000[12]
    Tb3+-functionalized metal-organic framework230.00--2×10⁵[53]
    GSH-AuNCs fluorescent sensor7.416.7--5000.0This work
    Table 1. Comparison with other detection methods
    No.Standard /(nmol·L-1)Test data /(nmol·L-1)Standard recovery rate /%RSD /%
    18086.3107.94.47
    2200213.4106.73.29
    3400389.697.42.41
    41000951.795.24.19
    520001858.392.95.69
    Table 2. Test results of Cu2+ in water samples
    Zhenping Liu, Rong Jiang, Kejing Pang. Highly Sensitive Detection of Copper Ions by Reduced Glutathione Modified Gold Nanocluster Fluorescence Sensor[J]. Laser & Optoelectronics Progress, 2021, 58(14): 1404002
    Download Citation