
V. V. Ivanov, A. V. Maximov, R. Betti, L. S. Leal, J. D. Moody, K. J. Swanson, N. A. Huerta. Generation of strong magnetic fields for magnetized plasma experiments at the 1-MA pulsed power machine[J]. Matter and Radiation at Extremes, 2021, 6(4): 046901
- Matter and Radiation at Extremes
- Vol. 6, Issue 4, 046901 (2021)
Abstract
I. INTRODUCTION
Developing a technique for generating strong magnetic fields allows the investigation of plasmas in megagauss (MG) fields. Strong magnetic fields change the basic properties of hot and dense plasmas, and studying magnetized plasmas is relevant to basic and applied plasma physics, controlled fusion research, and astrophysics. Astrophysical magnetic fields can reach 109 MG in magnetars1 and 1–100 MG in white-dwarf coronal plasmas.2 High magnetic fields also provide a better yield for inertial confinement fusion (ICF),3 and 30–40-MG magnetic fields are key for the MagLIF (magnetized liner inertial fusion) approach to fusion.4 Magnetic fields change the dynamics of plasma expansion,5–7 the development of plasma instabilities,8,9 and parametric effects.10 Laser–plasma interaction (LPI) in an external magnetic field demonstrates unusual plasma expansion, such as the generation of a disk-like plasma in a 2–3-MG transverse magnetic field.7 Narrow plasma jets are generated in longitudinal magnetic fields,5,6 astrophysical magnetized plasmas can be scaled to laboratory plasmas,5,11 and strong magnetic fields can also facilitate the enhanced laser-driven generation of proton beams12 and the fast ignition approach to ICF.13
The strongest magnetic fields of 20–30 MG are produced by either magnetic-flux compression driven by high explosive14 or multi-beam lasers.15 Laser-driven MG magnetic fields are generated using coil-capacitor targets: a 0.5–2-kJ laser beam produces plasma on a plate of the capacitor, fast electrons from the plasma charge another plate of the capacitor and induce current in the coil, and the current generates a magnetic field in the coil-capacitor laser target. Laser-driven B-fields of 2 MG have been demonstrated,16 and an 8-MG magnetic field has been reported.17
Mega-ampere (MA)-class pulsed power machines routinely generate MG magnetic fields. Ones of 2–3 MG have been generated in coil loads powered by a microsecond pulse with currents of 1–3 MA,18 and a university-scale generator coupled with a powerful laser can be used to study plasmas in strong magnetic fields.19
Several challenges are involved in generating and measuring strong magnetic fields. Coil discharge and LPI with the short laser pulse generate optical, x-ray, and electromagnetic (EM) bursts. Plasma starts on the coil surface and fills the internal area. Eddy currents in a fast-rising magnetic field and x-ray radiation can generate plasma on a target.20 The Zeeman effect has been applied to plasmas with temperatures of less than 15 eV.21 Proton radiography is used widely for measuring B-fields at laser facilities, but that diagnostic is sensitive to both magnetic and electrical fields and requires complex simulations.22 Faraday-rotation diagnostics face issues with laser-driven coils but can be used in pulsed power machines.20
Herein, a 1-MA generator is used as a platform for a wide class of experiments with plasmas in MG magnetic fields. In Sec. II, we present methods for generating and measuring strong magnetic fields in a pulsed power machine. Transverse and longitudinal magnetic fields of 1–4 MG are produced by rod and coil loads. The impact of the inter-coil discharge on the laser targets and Faraday diagnostics prevents the use of some load types, but half-turn coil loads are free of discharge during the current pulse, so these loads are used for LPI studies. In Sec. III, we present our experiments in strong magnetic fields. Penetration of a 1-MG field into a metal tube is presented, and LPI in the magnetic field is investigated. A laser-produced plasma in an MG azimuthal magnetic field is confined in the vertical direction and takes the unique form of a disk that expands radially. In a longitudinal magnetic field, the plasma plume is collimated and forms a long jet. Two-plasmon decay (TPD) in the MG field generates 3ω0/2 spectral components with strong widening and shift. Finally, we present our conclusions in Sec. IV.
II. PULSED POWER FACILITY FOR LASER–PLASMA INTERACTIONS IN MAGNETIC FIELDS
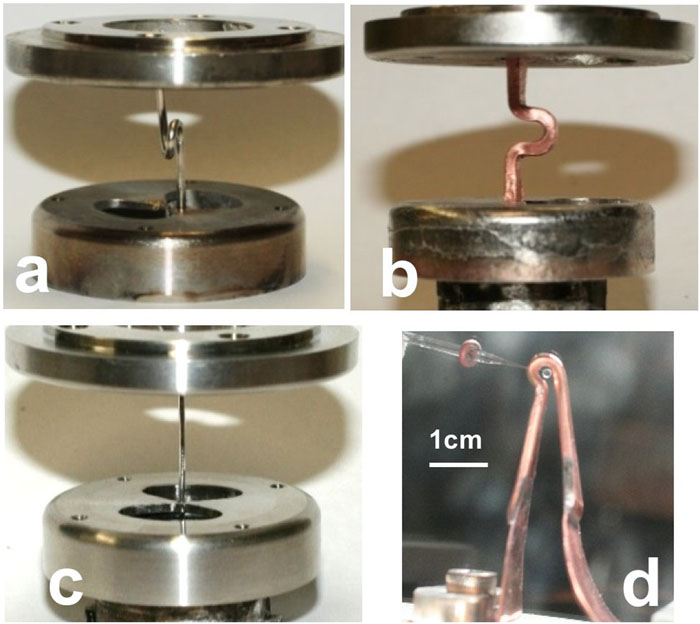
LPIs in MG magnetic fields were studied at the Zebra pulsed power generator at the University of Nevada, Reno (UNR). The generator produced a 1-MA current pulse with a rising edge of 80 ns (10%–90%), and the impedance of the transmission line was 1.9 Ω. A load current multiplier (LCM) increased the maximum current to 1.3–1.7 MA depending on the load inductance.23 The current was measured with B-dots installed in the transmission line and on the anode plate. The anode–cathode area allowed the apparatus to be installed inside the Zebra vacuum chamber. Laser diagnostics included shadowgraphy and interferometry at wavelengths of 213–1064 nm.24 The Zebra generator has been used widely for Z-pinch experiments and developing plasma diagnostics.25,26 The loads for generating magnetic fields are shown in Fig. 1. The spiral, half-turn coil, and rod loads in Figs. 1(a)–1(c) were installed in the 2-cm anode–cathode gap in the return-current cage with a diameter of 9.5 cm, and coil loads [Fig. 1(d)] were installed between the anode and cathode without the return-current cage.
![]()
Figure 1.(a) Spiral, (b) half-turn coil, and (c) rod loads for generating magnetic fields; the anode–cathode gap is 2 cm. (d) Coil load installed with no return-current cage.
A 50-TW Leopard laser was coupled with the pulsed power machine. The laser generated either a 0.4-ps pulse with an energy of 12 J at a wavelength of 1057 nm or a longer 0.8-ns laser pulse with an energy of 25 J.27 The amplified spontaneous emission contrast of the laser was 106. The wavefront of the laser beam was corrected with an adaptive mirror for better focusing. The laser target was embedded in the magnetic field of the coil, and a picosecond laser beam was focused on the target by an F/1.5 gold-coated Al parabolic mirror to an 8-µm focal spot with an intensity of 1019 W/cm2.
A. Characterization of magnetic fields
The magnetic fields produced by the Zebra generator were measured using Faraday-rotation diagnostics with two continuous-wave (CW) lasers at wavelengths of 532 and 405 nm. The Faraday rotation was measured in a Tb-doped glass sample that was 1 mm thick and 1.5 mm in diameter.
The two-color Faraday diagnostic discriminates the Faraday signal from the plasma emission and EM noise. A Faraday glass disk was placed either near or in the load between crossed high-contrast Glan prisms [Fig. 2(a)]. The combined laser beam was focused on the disk by a lens with a 3 m focal length, then the two component laser beams were separated using dichroic mirrors. The photodiodes used to measure the Faraday signal were filtered with narrowband interference filters. A shutter blocked the laser beams before the shot. The CW lasers provided a continuous history of the rotation of the Faraday angle during the Zebra current pulse. Side-on shadowgraphy and interferometry were used to detect plasma on the load, Faraday glass, and target.
![]()
Figure 2.(a) Two-color CW Faraday-rotation diagnostic. (b) Back-reflected Faraday-rotation diagnostic.
Faraday diagnostics can be affected by EM and particle emissions associated with generating strong magnetic fields. For example, electrical discharge in the coil produces strong x-ray and EM bursts and plasma on the coil surface. Plasma expanding from the coil surface may absorb a probing laser beam, so we modified the Faraday diagnostics to prevent propagation of the diagnostic beam through the coil and protect the Faraday glass against debris.
Figure 2(b) shows a sketch of the back-reflected Faraday diagnostic. The rear side of the Faraday glass disk is coated with a 50% dielectric mirror at 532 nm. The mirror splits the laser beam into two beams: one propagates through the disk and the coil, while the other reflects from the mirror on the Faraday glass. A component of the beam rotated in the B-field is separated by the polarizer as shown in Fig. 2(b).
A thin glass shield protects the mirror on the disk against plasma debris. In this configuration, the back-reflected beam does not pass through the coil. The back-reflected diagnostic was tested successfully with the laser-driven magnetic field at a laser energy of 25 J.28
Figure 3 shows measurements of the magnetic field in the rod load and half-turn coil. Figure 3(a) shows the current from the B-dot sensors (red line) and the waveforms of the Faraday rotation at the wavelengths of 405 nm (violet line) and 532 nm (green line). The Faraday glass disk was placed near the Al rod load with a diameter of 0.9 mm. Plasma on the surface of the rod was confined by the strong magnetic field but expanded with a speed of ∼3 km/s.29,30 To avoid contact with the expanding plasma, the Faraday glass disk was placed 1.7 mm from the axis of the Al rod as shown in Fig. 3(b). The maximum magnetic field was reconstructed from the total rotation of the polarization plane using the Verdet constant. Our measurements gave a Verdet constant of 170 rad−1 T−1 m−1 at 405 nm in the Tb glass disk that was used in the B-field measurements.20 The magnetic field at a current of 1 MA was 1.3 MG at both 532 and 405 nm. The Faraday signal decreased after the current maximum, and the shape of the magnetic pulse was that of the current measured by the anode B-dot sensors. The magnetic field on the surface of the load was 3 MG if a 1.3-MG field was measured 1.7 mm from the rod axis.
![]()
Figure 3.(a) Current pulse (red) and Faraday-rotation signals at 405 nm (violet) and 532 nm (green). (b) Glass disk near rod load. (c) Current pulse (red) and Faraday signals at 532 nm in half-turn coil. The black line shows the signal from the back-reflected beam and the green line shows the signal from the beam that passed through the coil.
Figure 3(c) shows the Faraday signal from the back-reflected beam (black line) and the signal from the beam that passed through the Faraday glass disk placed in the Ta 2.5-mm half-turn coil (green line). The number of periods of the rotation angle is higher by a factor of two in the back-reflected signal because of the double pass in the Faraday glass. Both channels indicate the same magnetic field with a maximum field of 1.4 MG. Shadowgraphy and interferometry showed no impact of the coil plasma on the Faraday glass disk, and the half-turn coil loads provide a friendly environment for LPI in a longitudinal magnetic field.
An LCM was developed to increase the maximum current of the Zebra generator.23 The LCM increases the current from the regular 1 MA to 1.3–1.7 MA depending on the load inductance. The generation of magnetic fields with the LCM was studied in the rod and half-turn coil loads, and the magnetic fields were measured using the two-color Faraday diagnostic.
Figure 4 shows the current pulse and the magnetic field in the two loads. The load current increased to 1.3 MA (red line), and the axial magnetic field in the center of the half-turn coil with a diameter of 2.5 mm reached 1.7 MG (blue line). The rod load with the LCM generated a 4-MG azimuthal magnetic field on the surface (black line). The LCM increases the magnetic field in the Zebra generator by ∼30%.
![]()
Figure 4.(a) Faraday target in coil. (b) Current pulse (red line) and magnetic field in 2.5-mm Ta coil (blue line) and on Al rod load with 0.9 mm initial diameter (black).
The Zebra generator produced a current with a rising front of 80 ns (10%–90%) and a magnetic-field rate of ∼107 MG/s. How eddy currents influence metal targets was found in Ref. 20. Aluminum targets were placed on the axis of the half-turn coil load 1 mm from the load edge, in which case no plasma impacted the targets during the current pulse. Laser diagnostics showed the expansion of the Al targets due to either evaporation or plasma formation during the current pulse. Target expansion was seen when compared to the reference shots without the current. Shadowgraphy and interferometry showed no plasma on the surfaces of Si and CH laser targets.
The eddy current in an Al target is estimated using a model of a ring with diameter d and cross section Sr. Faraday’s law gives the electromotive force in the ring as ε = S · dB/dt, where S is the area of the ring and B is the strength of the magnetic field. The target thickness is smaller than the skin depth: compared to the target thickness of 10–15 µm, the skin depth for Al at room temperature with a current with a rising front of ∼100 ns is 52 µm. The Al foil is heated, melted, evaporated, and ionized by eddy currents, and the energy of atomization Eat of Al can be compared with the eddy current power Ped:
Based on these results, Si and CH laser targets were used for LPI in a magnetic field. Note that the rate dB/dt is significantly higher in a laser-driven magnetic field (dB/dt > 109 MG/s) than in one driven by pulsed power, and this lower value of dB/dt with a ∼1-MA pulsed power machine has less impact on the target.
B. Cutoff of Faraday signal during discharge in load
For some load types, there is a cutoff of the Faraday signal at the beginning of the current pulse. We studied the generation of B-fields in such loads using both the two-color and back-reflected Faraday diagnostics. Figures 5(a) and 5(b) show the cutoff of the Faraday signals associated with the two coil loads shown in the insets. Figure 5(a) shows the results of a two-color Faraday diagnostic of a shot with a Cu coil load installed with no return-current cage. Laser beams at 532 and 405 nm passed through the coil center, and both Faraday signals display cutoff at the same time at the beginning of the current pulse. Explosion of these loads produces high-energy debris that destroys optics and windows in the vacuum chamber.
![]()
Figure 5.(a) Cutoff of Faraday signal in Cu coil without cage as detected with two-color diagnostic. (b) Cutoff in spiral load as detected with back-reflected diagnostic. The photographs show the loads, which correspond to those in
Figure 5(b) shows Faraday diagnostics with passed and reflected beams at the wavelength of 532 nm. The load was a stainless-steel spiral with a diameter of 3.5 mm, and the Faraday glass disk was placed near the one-turn spiral coil and protected by a thin glass plate. A fast decrease is seen in the signal that passed through the coil (green) and in the reflected signal with a double pass in the Faraday disk (black). Both signals fade at the same time. Additional experiments were carried out to clarify the origin of the cutoff in loads.
Stainless-steel spiral loads and various thicknesses of glass targets and distances from the loads were used. Figures 6(a) and 6(b) show the experimental configurations used to measure the Faraday signal in protected Tb glass and the induced adsorption in non-Faraday glass, respectively. A Faraday glass disk protected by a large 1.8-mm-thick non-Faraday glass plate is shown in Fig. 6(a). The reflected and passed Faraday signals also exhibited cutoff in this case. Next, we studied induced absorption in a borosilicate glass plate as shown in Fig. 6(b) and absorption in the spiral coil without glass. Polarizers were removed from the beam path, so a photodiode recorded the transmission at the wavelength of 532 nm. Figure 6(c) shows the current pulse and transmission of the laser beam in two shots. The beam passed through the coil without glass in one show (blue line) and through the glass plate and coil in the other shot (green line). The blue line shows that plasma in the 3.5-mm spiral coil decreased the transmission and blocked the beam 500 ns (blue arrow 2) after the beginning of the current pulse. The green line shows the induced absorption in the 1.8-mm-thick glass plate placed 6.5 mm from the spiral coil. The transparency of the glass at 532 nm dropped at a current of 0.2–0.3 MA (green arrow 1) and did not recover for 800 ns. Both signals increased after ∼900 ns (violet arrow 3) because of the strong plasma emission in the optical range. This emission may be linked to the explosion of the coil. Comparing the blue and green lines shows that plasma in the coil cannot provide the fast increase of absorption shown by arrow 1. The drop of transmission may be linked to generation of photoelectrons and color centers in the glass by the strong UV and x-ray bursts during the inter-coil discharge in the spiral load. The discharge in spiral loads is seen in x-ray pinhole images.
![]()
Figure 6.(a) and (b) Glass samples near spiral coil. (c) The current and laser beams passed through the coil (blue) and through the glass and coil (green).
Figure 7(a) shows the development of induced absorption in two borosilicate glass plates with thicknesses of 0.2 and 1.4 mm placed 6 and 12 mm, respectively, from the coil. The absorption was much larger in the thicker plate, and this dependence of the induced absorption on the glass thickness can be explained by the generation of photoelectrons and color centers in the glass volume. This dependence excludes absorption in the plasma on the glass surface because the thicker plate was located at the larger distance. No surface plasma was seen in the laser images if the glass plate was placed at a distance of greater than 6 mm. The absorption coefficient K calculated for the thinner glass plate is represented by the squares in Fig. 7, and the increase of K correlates with the rising power of the x-ray pulses generated by discharge in the load (blue line).
![]()
Figure 7.(a) Current pulses (red lines), x-ray pulse from discharge, and transmission in glass plates with thicknesses of 0.2 and 1.4 mm placed near a spiral load. The squares show the coefficient of induced absorption
To protect the glass plate against UV and x-ray pulses, a ceramic disk (3 mm thick with a 1-mm-wide channel for the laser beam) was attached to the 1-mm-thick glass plate. The edge of the ceramic disk was 4 mm from the spiral coil. During the shot with a spiral load, the transmission of the ceramic-protected glass decreased slowly to 0.4, as seen in Fig. 7(b).
Faraday diagnostics can be affected by the discharge and x-ray bursts in the load, and eddy currents generated by the load can impact the laser targets. Using half-turn coils and dielectric targets solves these issues in experiments performed at pulsed power generators. In the aggressive spiral loads, Faraday diagnostics should be protected against x-ray radiation.
III. EXPERIMENTS WITH MEGAGAUSS MAGNETIC FIELDS
In this section, we present experiments on magnetic fields performed at the 1-MA pulsed power facility.
A. Penetration of 1-MG field into a metal tube
Load testing showed that spiral loads and coils with no return-current cage are not acceptable for experiments, but half-turn coils and rod loads are good choices for precision plasma experiments in strong longitudinal and transverse magnetic fields. These loads generate B-fields safely and do not impact the target. We studied the penetration of the axial magnetic field of the half-turn coil into a metal tube.
The experimental scheme is shown in Fig. 8(a). A metal tube with a Faraday glass disk inside it was placed in the coil load 3 mm in diameter as shown in Fig. 8(b). Two crossed polarizers were parts of the CW Faraday-rotation diagnostic at 532 nm. The tube parameters are given in Table I. Tubes were made of stainless-steel alloy 316 and Cu 101 with 99.99% purity. Each tube had the same length L, external diameter 2R, and wall thickness δ, but the resistivity ρ of the materials varied by a factor of ∼60.
![]()
Figure 8.(a) Experimental setup for measuring B-field in tube. (b) Tube in coil. (c) CU tube with slit. (d) Magnetic field in tube center reconstructed from Faraday rotation angle.
| Alloy | L (mm) | 2R (mm) | δ (mm) | ρ (μΩ m) | τ | Bmax (MG) |
|---|---|---|---|---|---|---|
| SS316 | 5 | 1.83 | 0.12 | 0.78 | 87 ns | 1.02 |
| Cu101 | 5 | 1.83 | 0.11 | 0.0171 | 4 µs | 0.36 |
| No tube | 1.2 |
Table 1. Parameters of tubes and the B-field inside.
Figure 8(d) shows the magnetic field in the tube center reconstructed from the Faraday rotation angle. The B-field without the tube and with a maximum strength of 1.2 MG (red line) follows the shape of the current pulse. The blue line shows the magnetic field in the stainless-steel tube: the maximum strength of the B-field is 1.02 MG, and the B-pulse is delayed by ∼40 ns compared to the field of the coil. The maximum strength of the magnetic field in the Cu tubes is only ∼30% of that in free space, and the magnetic field in the stainless-steel tube reaches 85% of the B-field strength without the tube.
The soak-in time τ for a tube with constant resistivity was estimated using τ = 0.5μ0Rδ/ρ,31 where μ0 = 4π × 10−7 H/m is the permeability of free space. The calculated values of τ are given in Table I. However, the resistivity of the tube material is not constant because of the heating by eddy currents and the formation of plasma on the surface of the cylinder. The energy deposition and atomization time were calculated by Eq. (1) using the enthalpy of atomization Hat, the density ϱ, and the resistivity ρ at the evaporation point (2835 K for Cu). For a magnetic field with a rate of dB/dt = 107 MG/s and a Cu tube with a diameter of d = 2 mm, the atomization time is 51 ns and the atomization energy is 130 J. The magnetic energy of the coil at a current of 1 MA is much higher than the atomization energy, i.e., LI2/2 = 700 J, and the magnetic energy density in the tube center is 4 J/mm3. Plasma on the edges of the Cu tube during the shot is shown by the arrows in the shadowgraphs in Fig. 9(d). The surface plasma can short the load current through the tube, but no surface plasma was seen on the stainless-steel tubes.
![]()
Figure 9.(a) Soak-in time
The soak-in time τ can be calculated from the experimental dynamics of the magnetic field Bin inside the tube and Bout outside the tube by31
Figure 9(a) compares τ calculated from Fig. 8(d). The value of τ for the Cu tube is much higher than that for the stainless-steel tube, and the trend of decreasing τ can be linked to the rise of resistivity during the shot due to the heating of the tube material by eddy currents.
Mitigating the impact of eddy currents was demonstrated by using tubes with a gap along the axis. A Cu tube with a slit gap is shown in Fig. 8(c). As shown by the black line in Fig. 9(b), the slit dramatically increases the penetration of the magnetic field in the Cu tube and decreases the delay. The slit mitigates the eddy currents and makes the shape of the magnetic field at the rising edge similar to that of the external B-field. The maximum B-field in the slit of the Cu tube reaches 40% of the field in free space. The black line in Fig. 9(b) indicates two stages for the characteristic time τ. The stage with τ ∼ 0 corresponds to the infinite circle resistivity due to the slit, while the fast-rising stage may be linked to the flashover through the glass surface in the slit produced by the high circular voltage that can reach 4 kV.
The experiments showed that a 1-MG magnetic field was delivered for ∼40 ns into the metal tube with the conductivity of stainless steel. Eddy currents prevented the field from penetrating the Cu tube but were mitigated by the axial slot in the tube. This result may be relevant to ICF with a hohlraum target in the magnetic field.32
B. Laser–plasma interaction in azimuthal magnetic field
Unusual dynamics of plasma expansion in the azimuthal 1–3-MG magnetic field of a rod load were observed in Ref. 7. In this section, we present results from an additional series of shots. Figure 10(a) shows a schematic of the experiment with a laser pulse focused on the surface of an Al rod load 0.9 mm in diameter. Current in the load generates an azimuthal magnetic field on the rod surface. The laser intensity in the focal spot was (3–5) × 1015 W/cm2. Without the laser pulse, the strong magnetic field contained the plasma arising on the surface of the load. After the laser shot, side-on laser imaging diagnostics showed the formation of two plasma jets on the front and rear sides of the load. The two shadowgraphs and the interferogram in Figs. 10(b)–10(d) show jets of laser-produced plasma at the wavelengths of 532, 266, and 213 nm at 6 ns after the laser pulse. The magnetic field on the rod surface was B = 1.3 MG. One plasma jet propagated back from the focal spot, and the second smaller jet was seen on the rear side of the rod load. Fringes in the UV interferogram [Fig. 10(d)] were undeviated, indicating the high plasma density with sharp gradients in the side-on view.
![]()
Figure 10.(a) Experimental setup for laser–plasma interaction. (b)–(d) Side-on shadowgraphs and interferogram of plasma jets at three wavelengths in one laser shot.
The end-on diagnostics in Fig. 11 explain the front and rear jets as parts of a plasma disk around the load. Plasma propagated along the magnetic field and formed a thin disk around the load. The shadowgraphs do not show the plasma because of the small areal density in the vertical direction, but the schlieren diagnostics and interferometry at 532 and 1064 nm show a plasma disk and rings with high gradients. Infrared diagnostics were used because of their higher sensitivity to the low-density plasma.
![]()
Figure 11.(a) and (c) End-on schlieren images. (b) and (d) Interferograms. (e) Side-on shadowgraph of plasma disc with tilted probing beam.
Ring structures in the plasma are seen in the end-on schlieren images, interferograms, and the side-on shadowgraph with a tilted laser beam. The plasma disk looks like Saturn’s rings in Fig. 11(e) because of the magnetosonic-like structures. The radial size of the disk was greater and the plasma density was higher in the front half of the disk, so the disk was not symmetric. Plasma expansion was observed for more than 10 ns after the laser pulse. The electron plasma density in the rings was (6–8) × 1018 cm−3. The disk formed only in the presence of a strong azimuthal B-field. The laser plume that formed in a weaker azimuthal magnetic field was shaped like the sector in end-on laser diagnostics.33
Two-frame shadowgraphs and interferograms showed that the disk expanded radially with a speed of ∼250 km/s. The electron temperature of the plasma on the load was measured from the x-ray Al K-shell spectra. PrismSPECT simulations34 showed the best fit for the electron temperature of 400 eV in the area of interaction. Generation of plasma discs was observed in LPI with Al, Cu, and Ti rod loads.
Two-dimensional magnetohydrodynamic (MHD) simulations of a plasma in a strong transverse magnetic field were performed in Ref. 35. The modeling was carried out in a cylindrical geometry. Simulations with a current in the rod that resulted in a magnetic field of 3 MG on the rod showed the formation of a density wave localized axially and moving radially with a speed of ∼250 km/s, in reasonable agreement with the experiments. The density wave continued to propagate after the end of the laser pulse. The azimuthal magnetic field changed strongly in time in the region of the density wave because of the magnetic field generated by crossing the density and temperature gradients. The change in the azimuthal magnetic field due to the density wave was comparable to the magnitude of the azimuthal field generated by the current in the rod. The magnetic β parameter was approximately unity 1–2 ns after the laser pulse and then decreased thereafter. This magnitude of β in the plasma disk clarifies that it is the thermal pressure that is responsible for the motion of plasma. When plasma moves radially away from the rod, the thermal pressure decreases, and the magnetic pressure plays the main role in the plasma expansion.
The plasma configuration in the MHD simulations is shown in Figs. 12(a) and 12(b) and agrees with the side-on shadowgraphs in Figs. 10(b) and 11(e). The laser-produced plasma in a strong external azimuthal magnetic field is confined vertically and takes the unique shape of a thin disk that expands radially. Plasma dynamics in a strong transverse magnetic field are relevant to astrophysical plasmas, e.g., the expansion of plasmas in solar flares.
![]()
Figure 12.(a) Density and (b) temperature of ablated plasma in 3-MG external magnetic field calculated 4 ns after end of laser pulse.
C. Laser–plasma interaction in longitudinal magnetic field
Laser-produced plasma is collimated during its expansion in a magnetic field starting from 10 kG.36 Plasma takes the shape of a jet in a longitudinal magnetic field of 0.1–0.2 MG.5,37–39 A 1-MA pulsed power machine allows the investigation of plasma jets in stronger magnetic fields.6
Plasma in the coil field was produced by the Leopard laser operated with a 0.4-ps pulse. The intensity of the laser beam in the focal spot was (2–6) × 1018 W/cm2. The laser target was placed 1 mm from the Cu coil 2.5–3 mm in internal diameter. The axial B-field at this point was 0.5–0.7 MG depending on the timing relative to the current pulse. An Si laser target was used to avoid the influence of eddy currents. The target was 2 × 2 mm2 in size and 10 µm thick. The plasma dynamics were studied with two-frame laser imaging diagnostics, and the plasma temperature and density were measured with x-ray K-shell spectroscopy.
The interferogram and shadowgraph in Fig. 13 show the collimation of the plasma and the formation of a long plasma jet on the front side and a shorter rear jet in a B-field of 0.7 MG. A plasma plume began to focus at ∼1 mm from the target and formed a narrow jet. The propagation speed of the jet tip calculated from two-frame shadowgraphy and interferometry was ∼200 km/s. MHD simulations (dotted line in Fig. 14) agreed well with the experimental data points. The electron density of the plasma on the axis of the laser-produced jet was (0.2–1.5) × 1020 cm−3 as shown in Fig. 15, which also shows the jet width. Laboratory plasma jets of this type can be scaled to astrophysical jets.5,11
![]()
Figure 13.(a) Interferogram and (b) shadowgraph of Si target during current and magnetic field in coil load 7 ns after laser pulse. (c) Schematic of laser beam (L) and target (T) near coil load.
![]()
Figure 14.Squares: position of jet tip. Dashed line: MHD simulation.
![]()
Figure 15.(a) Electron density and width of plasma jet reconstructed from interferogram.
The jet propagation was modeled using the radiation hydrodynamic code HYDRA using a mesh that was symmetric with respect to the propagation direction. In the simulations, the boundary conditions generated a magnetic field with a spatial profile similar to that in the experiments. Plasma expands from the target forming a jet, and the magnetic field in the plasma is much weaker compared to the external magnetic field. At the same time, the magnetic field at the plasma edges increases and becomes larger than the external field, resulting in collimation due to magnetic pressure. The formation of the jet in the simulations is shown in Fig. 16, corresponding to 6 ns after the end of the laser pulse. The highest value of plasma density is reached in the plasma region that is strongly magnetized. While the magnetic field is compressed at the edges of the jet, it is much weaker inside the jet, forming a magnetic-field envelope that maintains the collimated jet during all of its evolution. Later in the jet propagation, the diffusion of the magnetic field into the envelope makes the field inside the envelope close to that on its edge. The jet tip 6 ns after the laser pulse is located at ∼2.2 mm and is moving with a speed of 200–400 km/s. In the jet, the electron temperature is 10–100 eV and the electron density is between 1019 and 5 × 1020 cm−3. A plasma jet in a magnetic field depends on the magnetic β parameter being small, given that the magnetic pressure maintains the jet collimation when it moves in the direction of the magnetic field (the jet width is ∼0.1 to 0.2 mm). Figure 14 shows the expansion of the jet tip in the simulations (the dashed line), and the positions in the experiments and simulations clearly agree well.
![]()
Figure 16.Two-dimensional MHD simulation of electron density of plasma jet 6 ns after laser pulse. The laser pulse irradiating the target comes from the left along the axial magnetic field, and the target is at
Time-integrated K-shell spectra of the ablated plasma were analyzed to study how the magnetic field influences the electron density and temperature of the plasma. Simulations40 showed that a target pre-plasma achieved the critical density during the pre-pulse of the sub-picosecond laser pulse, so the main energy of the pulse does not reach the target. Spectra of Si plasma were recorded by a spherically bent quartz crystal in the range of 7.1–8 Å with a spectral resolution of 1300. The spectra were analyzed with the PrismSPECT program, which uses the atomic data necessary for spectral simulations of a laser-produced plasma with a laser-generated electron beam. A Heα line and associated satellite lines were analyzed. The ratio of the intensity of the Heα resonance line to that of the intercombination y line and the ratio of the intercombination line to (j + k) satellites in experiments were compared with those from PrismSPECT simulations.6 An external magnetic field of 0.6–0.7 MG increased the experimental Heα/y ratio from 5.6 to 7.1 and decreased y/(j + k) from 1.7 to 1.2. These ratios indicate an increase of the plasma electron density by a factor of 2–3 and a temperature increase of 3%. The K-shell spectra characterized the plasma produced by the amplified-spontaneous-emission pre-pulse.
The laser-produced plasma was collimated to a narrow dense jet in the longitudinal magnetic field, and the jet tip propagated with a speed of 160–200 km/s. The plasma jet can be scaled to astrophysical jets,5,11 and the MHD simulations gave jet dynamics that agreed with experimental data.
D. Two-plasmon decay in megagauss magnetic fields
TPD plays an important role in LPI and ICF41 and occurs at electron plasma densities of around one quarter of the plasma critical density nc for the laser frequency. During TPD, an incident laser photon decays into two Langmuir waves (plasmons) with frequencies of roughly half the frequency ω0 of the pump photon but with blue and red spectral shifts compared to the ω0/2 frequency. Wave conversion involving these two plasmons generates new light waves with frequencies of around ω0/2.42–45 A beam of blue photons may have smaller intensity as it propagates into the dense plasma and reflects from it, leading to a longer path. Wave conversion involving TPD plasmons can also generate light with a frequency of around 3ω0/2 and that easily leaves a plasma, making for a robust diagnostic.42–45 For back-scattered light near the frequency of 3ω0/2, the spectral shift (μm) of the blue and red components can be estimated as Δλ3/2 = 4 × 10⁻³λ0Te, where λ0 (μm) is the wavelength of the laser and Te (keV) is the electron temperature of the plasma.42–45 The strong magnetic field produces a shift proportional to the square of the electron Larmor frequency ωce, i.e., ∼(ωce)2/ω0, in addition to the thermal shifts of the red and blue spectral components.43
A narrow band Nd:glass laser was used in TPD experiments. The laser generated pulses at 1053 nm with Δλ0 ∼ 10 pm and an energy of 6 J at 2 ns. Al and Ni rod loads 1 mm in diameter were used to generate a magnetic field of 2–3 MG in the surface plasma. A laser pulse with an intensity of (1–3) × 1014 W/cm2 was focused on the rod surface, the spectral components of 3ω0/2 light at the central wavelength of 702 nm were relayed to the slit of the spectrometer by a lens system, and an intensified charge-coupled device (ICCD) camera was used to record the 3ω0/2 emission.
Figure 17(a) shows the 3ω0/2 spectra from the Al rod load. The strong 2–3-nm widening and 2–4-nm shift of the red and blue 3ω0/2 spectral components were observed. Both the red and blue 3ω0/2 components are clearly seen, but the blue component is weaker. The 3ω0/2 emission was not seen in Ni and Cu loads. This is consistent with observations19,46 that plasma develops later on Cu and Ni rod loads compared to on an Al load. LPI does not generate TPD without current, which produces the surface plasma in Al loads. The 3ω0/2 emission can only be observed if the TPD instability develops in a plasma layer, and the TPD threshold is inversely proportional to the density scale length near the quarter-critical plasma density.41,42 The strong 3ω0/2 emission in Fig. 17(a) indicates an extended plasma with a gradual density profile, and the absence of 3ω0/2 emission in Fig. 17(b) indicates a more-localized plasma with a steep density profile.
![]()
Figure 17.(a) Spectrum of 3
The experiments show that the 1-MA generator can be used successfully to investigate parametric effects in MG fields. The features of TPD in a magnetized plasma will be studied in future simulations and experiments with streaked spectroscopy.
IV. CONCLUSIONS
Plasmas in magnetic fields constitute a topic of considerable interest given their relevance to basic plasma physics, ICF, and laboratory astrophysics. The 1-MA Zebra generator at UNR was used to produce MG longitudinal and transverse magnetic fields in coil and rod loads, and a 50-TW laser was used with the Zebra machine for LPI experiments.
It was shown that the 1-MA pulsed power machine provides a robust platform for experiments with plasmas in MG magnetic fields. Several types of load were tested to optimize the strength of the magnetic field, and the selected loads generated the highest magnetic fields in a safe manner for the target. The magnetic fields in the loads were measured by Faraday-rotation diagnostics. Rod loads provided 2–4-MG transverse magnetic fields on the rod surface, and half-turn coils produced 1–1.7-MG longitudinal fields. These loads did not impact the targets through plasma debris or x-ray bursts. The inter-coil discharge in the spiral coil loads produced a cutoff of the Faraday signal even in the back-reflected configuration. The x-ray/UV bursts generated photoelectrons and color centers and changed the opacity of the glass sample. Only friendly half-turn coils and rod loads were used in the plasma studies. Various experiments showed that a pulsed power machine is an effective tool for investigating plasmas in MG magnetic fields.
Fast penetration of the axial magnetic field into a metal tube was shown. A 1-MG field soaked into a stainless-steel tube during the current pulse of the Zebra generator, whereas the high conductivity of a Cu tube prevented the magnetic field from soaking therein. A slit in the Cu tube mitigated eddy currents and improved the penetration of the magnetic field. This study shows the possibility of using an MG field to magnetize a hohlraum capsule. A compact linear-transformer-driver pulsed power generator can deliver a 1–2-MA current pulse in the coil through the magnetically isolated transmission line.
The dynamics of the expansion of a laser-produced plasma in strong transverse and longitudinal magnetic fields were studied with the rod and coil loads. The expanding plasma took the shape of a thin plasma disk in the azimuthal field of the rod load. The plasma was confined vertically by a 2–3-MG field but expanded radially with a speed of ∼250 km/s. The magnetic β in the plasma was β ∼ 1 right after the laser pulse and then decreased subsequently. In a longitudinal magnetic field, the laser-produced plasma generated narrow 3–4-mm jets with densities of 1019–1020 cm−3. Plasma in a strong B-field is scaled to an astrophysical plasma. The TPD parametric instability generated wide and shifted red and blue components of 3ω0/2 emission in a 2–2.7-MG field. The TPD instability in the magnetic field is relevant to ICF in magnetized plasmas.
Finally, pulsed power technology provides a capability for investigating plasmas and laser–matter interaction in 1–4-MG magnetic fields in a university-scale machine.
ACKNOWLEDGMENTS
Acknowledgment. The authors thank the team at the Zebra generator at UNR for help with the experiments. This work was supported by the NSF (Grant No. PHY-1903355) through the NSF–DOE Partnership in Basic Plasma Science and Engineering and by the DOE NNSA (Grant No. DE-NA0003991). This work was performed partially under the auspices of the U.S. Department of Energy by the Lawrence Livermore National Laboratory (Contract No. DE-AC52-07NA27344).
References
[1] L.Barbier, S.Barthelmy, T.Cayton, M.Chester, J.Cummings, D.Eichler, E. E.Fenimore, M. H.Finger, B. M.Gaensler, N.Gehrels, J.Granot, D.Hullinger, R. M.Kippen, C.Kouveliotou, H.Krimm, Y. E.Lyubarsky, C. B.Markwardt, J. A.Nousek, D. M.Palmer, A.Parsons, S.Patel, E.Ramirez-Ruiz, T.Sakamoto, G.Sato, M.Suzuki, J.Tueller, R. A. M. J.Wijers, P. M.Woods. A giant γ-ray flare from the magnetar SGR 1806–220. Nature, 434, 1107-1109(2005).
[2] R.Aznar Cuadrado, S.Jordan, R.Napiwotzki, H. M.Schmid, S. K.Solanki. The fraction of DA white dwarfs with kilo-Gauss magnetic fields. Astron. Astrophys., 462, 1097-1101(2007).
[3] R.Betti, P. Y.Chang, G.Fiksel, M.Hohenberger, J. P.Knauer, F. J.Marshall, D. D.Meyerhofer, R. D.Petrasso, F. H.Séguin. Fusion yield enhancement in magnetized laser-driven implosions. Phys. Rev. Lett., 107, 035006(2011).
[4] J. M.Koning, M. M.Marinak, K. J.Peterson, A. B.Sefkow, D. B.Sinars, S. A.Slutz, R. A.Vesey. Design of magnetized liner inertial fusion experiments using the Z facility. Phys. Plasmas, 21, 072711(2014).
[5] B.Albertazzi, J.Béard, J.Billette, R.Bonito, M.Borghesi, Z.Burkley, S. N.Chen, A.Ciardi, T. E.Cowan, A. Ya.Faenov, A.Frank, J.Fuchs, T.Herrmannsd?rfer, D. P.Higginson, M.Huarte-Espinosa, F.Kroll, M.Nakatsutsumi, K.Naughton, H.Pépin, S. A.Pikuz, O.Portugall, G.Revet, C.Riconda, R.Riquier, L.Romagnani, H. P.Schlenvoigt, I. Yu.Skobelev, A.Soloviev, T.Vinci. Laboratory formation of a scaled protostellar jet by coaligned poloidal magnetic field. Science, 346, 325(2014).
[6] R.Betti, C. J.Fontes, I. E.Golovkin, V. V.Ivanov, L. S.Leal, R. C.Mancini, A. V.Maximov, H.Sawada, A. B.Sefkow, K. J.Swanson, N. L.Wong. Study of laser produced plasma in a longitudinal magnetic field. Phys. Plasmas, 26, 062707(2019).
[7] R.Betti, P.Hakel, V. V.Ivanov, A. V.Maximov, M. E.Sherrill, P. P.Wiewior. Generation of disk-like plasma from laser-matter interaction in the presence of a strong external magnetic field. Plasma Phys. Controlled Fusion, 59, 085008(2017).
[8] Y.Arikawa, H.Azechi, S.Fujioka, S.Kojima, Y.Kuramitsu, K. F. F.Law, S. H.Lee, K.Matsuo, T.Morita, H.Nagatomo, P.Nicolai, S.Sakata, Y.Sakawa, T.Sano, Z.Zhang. Magnetohydrodynamics of laser-produced high-energy-density plasma in a strong external magnetic field. Phys. Rev. E, 95, 053204(2017).
[9] J.Grun, A. B.Hassam, J.Huba, C. K.Manka, E. A.McLean, A. N.Mostovych, C.Pawley, T. A.Peyser, B. H.Ripin, J. A.Stamper. Large-Larmor-radius interchange instability. Phys. Rev. Lett., 59, 2299(1987).
[10] V. B.Krasovitskiy, V. I.Sotnikov, V. A.Turikov. Nonlinear dispersion of resonance extraordinary wave in a plasma with strong magnetic field. Phys. Plasmas, 14, 092108(2007).
[11] R. P.Drake, J.Kane, E.Liang, B. A.Remington, D.Ryutov, W. M.Wood‐Vasey. Similarity criteria for the laboratory simulation of supernova hydrodynamics. Astrophys. J., 518, 821(1999).
[12] A.Arefiev, G.Fiksel, T.Toncian. Enhanced proton acceleration in an applied longitudinal magnetic field. New J. Phys., 18, 105011(2016).
[13] Y.Abe, Y.Arikawa, H.Azechi, M.Bailly-Grandvaux, S.Fujioka, M.Hata, Y.Iwasa, N.Iwata, T.Johzaki, J.Kawanaka, H.Kishimoto, R.Kodama, S.Kojima, K. F. F.Law, S.Lee, K.Matsuo, K.Mima, N.Miyanaga, A.Morace, H.Morita, H.Nagatomo, M.Nakai, Y.Nakata, H.Nishimura, T.Norimatsu, T.Ozaki, H.Sakagami, S.Sakata, J. J.Santos, H.Sawada, Y.Sentoku, H.Shiraga, T.Shiroto, A.Sunahara, A.Syuhada, S.Tokita, K.Yamanoi, A.Yao, A.Yogo. Magnetized fast isochoric laser heating for efficient creation of ultra-high-energy-density states. Nat. Commun., 9, 3937(2018).
[14] G. V.Boriskov, A. I.Bykov, M. I.Dolotenko, N. I.Egorov, Y. B.Kudasov, V. V.Platonov, V. D.Selemir, O. M.Tatsenko. Research in ultrahigh magnetic field physics. Phys.-Usp., 54, 421(2010).
[15] R.Betti, P. Y.Chang, J. A.Frenje, O. V.Gotchev, J. P.Knauer, C. K.Li, M. J.-E.Manuel, D. D.Meyerhofer, R. D.Petrasso, O.Polomarov, J. R.Rygg, F. H.Séguin. Compressing magnetic fields with high-energy lasers. Phys. Plasmas, 17, 056318(2010).
[16] L.Divol, W. A.Farmer, S.Fujioka, C.Goyon, B.Grant Logan, D.Haberberger, A.Hazi, J.Javedani, A. J.Johnson, A.Kemp, O. L.Landen, K. F. F.Law, M. C.Levy, D. A.Mariscal, J. D.Moody, S.Patankar, B. B.Pollock, J. S.Ross, A. M.Rubenchik, G. F.Swadling, D. P.Turnbull, G. J.Williams. Ultrafast probing of magnetic field growth inside a laser-driven solenoid. Phys. Rev. E, 95, 033208(2017).
[17] M.Bailly-Grandvaux, D.Batani, R.Bouillaud, M.Chevrot, J. E.Cross, R.Crowston, E.d’Humières, S.Dorard, J.-L.Dubois, P.Forestier-Colleoni, S.Fujioka, J.Gazave, L.Giuffrida, G.Gregori, S.Hulin, K.Ishihara, S.Kojima, P.Korneev, E.Loyez, J.-R.Marquès, A.Morace, P.Nicola?, O.Peyrusse, A.Poyé, D.Raffestin, J.Ribolzi, M.Roth, J. J.Santos, G.Schaumann, F.Serres, V. T.Tikhonchuk, P.Vacar, N.Woolsey, Z.Zhang. Laser-driven platform for generation and characterization of strong quasi-static magnetic fields. New J. Phys., 17, 083051(2015).
[18] T.Goto, F.Herlach, N.Miura, K.Nakao, T.Sakakibara, S.Takeyama. A laboratory instrument for generating magnetic fields over 200 T with single turn coils. J. Phys. E: Sci. Instrum., 18, 1018(1985).
[19] A. L.Astanovitskiy, A. M.Covington, V. V.Ivanov, A. V.Maximov, G. S.Sarkisov, K. J.Swanson, P. P.Wiewior, N. L.Wong. Experimental platform for investigations of high-intensity laser plasma interactions in the magnetic field of a pulsed power generator. Rev. Sci. Instrum., 89, 033504(2018).
[20] A. L.Astanovitskiy, O.Chalyy, O.Dmitriev, V. V.Ivanov, A. V.Maximov, V.Nalajala, G. S.Sarkisov, K. J.Swanson, P. P.Wiewior, N. L.Wong. Observation of impact of eddy current on laser targets in a strong fast rising magnetic field. Phys. Plasmas, 24, 112707(2017).
[21] D. E.Bliss, A. L.Carlson, M. R.Gomez, S. B.Hansen, D. C.Lamppa, K. J.Peterson, G. A.Rochau, D. G.Schroen. Magnetic field measurements via visible spectroscopy on the Z machine. Rev. Sci. Instrum., 85, 11E609(2014).
[22] D. H.Barnak, R.Betti, M. J.Bonino, T.Cracium, J. R.Davies, J. L.Peebles. Axial proton probing of magnetic and electric fields inside laser-driven coils. Phys. Plasmas, 27, 063109(2020).
[23] A. L.Astanovitskiy, A. S.Chuvatin, W.Cline, M. E.Cuneo, V. L.Kantsyrev, B.LeGalloudec, K. A.Mikkelson, V.Nalajala, G. C.Osborne, T. D.Pointon, R.Presura, L. I.Rudakov, A. S.Safronova, I.Shrestha, K. M.Williamson. Operation of a load current multiplier on a nanosecond mega-ampere pulse forming line generator. Phys. Rev. Spec. Top.--Accel. Beams, 13, 010401(2010).
[24] A. A.Anderson, I. A.Begishev, V. V.Ivanov. Four-color laser diagnostics for
[25] S. D.Altemara, A. A.Anderson, J. P.Chittenden, V. V.Ivanov, R. C.Mancini, N.Niasse, D.Papp. Investigation of plasma instabilities in the stagnated Z pinch. Phys. Rev. E, 86, 046403(2012).
[26] A. A.Anderson, V. V.Ivanov, D.Papp. Investigation of wire-array Z-pinches by laser probing diagnostics. Matter Radiat. Extremes, 4, 017401(2019).
[27] O.Chalyy, V. V.Ivanov, P. P.Wiewior. Development of the 50 TW laser for joint experiments with 1 MA z-pinches. J. Phys.: Conf. Ser., 244, 032013(2010).
[28] A. L.Astanovitskiy, I. A.Begishev, R.Betti, J.Bromage, J. R.Davies, V. V.Ivanov, A. V.Maximov, C.Mileham, J. D.Moody, C.Stoeckl, K. J.Swanson, N. L.Wong. Study of laser-driven magnetic fields with a continuous wave Faraday rotation diagnostic. Phys. Plasmas, 27, 033102(2020).
[29] T. J.Awe, B. S.Bauer, R. S.Bauer, S.Fuelling, T. M.Hutchinson, V. V.Ivanov, J.Mei, K. C.Yates. Significant change in threshold for plasma formation and evolution with small variation in copper alloys driven by a mega-ampere current pulse. Phys. Plasmas, 26, 042708(2019).
[30] T. J.Awe, B. S.Bauer, S.Fuelling, T.Goodrich, A.Haboub, V. V.Ivanov, V.Makhin, A.Oxner, R.Presura, R. E.Siemon. A Zebra experiment to study plasma formation by megagauss fields. IEEE Trans. Plasma Sci., 36, 62(2008).
[31] H.Knoepfel. Pulsed High Magnetic Fields(1970).
[32] E.Carroll, J.Fry, J.Javedani, A.Johnson, B.Kozioziemski, S. O.Kucheyev, B. G.Logan, J. D.Moody, B. B.Pollock, H.Sio, D.Strozzi, W. A.Stygar, V.Tang, S.Winters. Transient magnetic field diffusion considerations relevant to magnetically assisted indirect drive inertial confinement fusion. Phys. Plasmas, 27, 112711(2020).
[33] C.Chiu, T. E.Cowan, T.Ditmire, I.Doxas, A.Esaulov, W.Horton, V. V.Ivanov, N.Le Galloudec, R.Presura, Y.Sentoku, V. I.Sotnikov, P.Valanju. Laboratory simulation of magnetospheric plasma shocks. Adv. Space Res., 39, 358-369(2007).
[34] I. E.Golovkin, J. J.MacFarlane, N. A.Pereyra, P.Wang, P. R.Woodruff. SPECT3D—A multi-dimensional collisional-radiative code for generating diagnostic signatures based on hydrodynamics and PIC simulation output. High Energy Density Phys., 3, 181(2007).
[35] R.Betti, V. V.Ivanov, L. S.Leal, A. V.Maximov, A. B.Sefkow. Modeling magnetic confinement of laser-generated plasma in cylindrical geometry leading to disc-shaped structures. Phys. Plasmas, 27, 022116(2020).
[36] A. N.Mostovych, B. H.Ripin, J. A.Stamper. Laser produced plasma jets: Collimation and instability in strong transverse magnetic fields. Phys. Rev. Lett., 62, 2837(1989).
[37] A.Kasperczuk, R.Miklaszewski, T.Pisarczyk. Influence of the illumination characteristics on the laser plasma dynamics in a strong axial magnetic field. Phys. Scr., 54, 636(1996).
[38] B.Albertazzi, A.Ciardi, J.Fuchs, H.Pepin, O.Portugall, C.Riconda, T.Vinci. Astrophysics of magnetically collimated jets generated from laser-produced plasmas. Phys. Rev. Lett., 110, 025002(2013).
[39] J.Beard, K.Burdonov, M.Cerchez, S. N.Chen, A.Ciardi, E.Filippov, J.Fuchs, T.Gangolf, B.Khiar, S. S.Makarov, M.Ouille, S.Pikuz, G.Revet, M.Safronova, I. Yu.Skobelev, A.Soloviev, M.Starodubtsev, O.Willi. Laser-produced magnetic-Rayleigh-Taylor unstable plasma slabs in a 20 T magnetic field. Phys. Rev. Lett., 123, 205001(2019).
[40] A.Bass, F.Beg, H.Chen, B.Griffin, A. J.Link, H.McLean, R.Pandit, P. K.Patel, H.Sawada, Y.Sentoku. Characterization of intense laser-produced fast electrons using hard x-rays via bremsstrahlung. J. Phys. B: At., Mol. Opt. Phys., 48, 224008(2015).
[41] W. L.Kruer. The Physics of Laser Plasma Interactions(1988).
[42] H. A.Baldis, D. H.Edgell, V. N.Goncharov, A. V.Maximov, J. F.Myatt, W.Seka, R. W.Short. Two-plasmon-decay instability in direct-drive inertial confinement fusion experiments. Phys. Plasmas, 16, 052701(2009).
[43] N. G.Basov, V. Yu.Bychenkov, M. O.Koshevoi, M. V.Osipov, A. A.Rupasov, D. V.Shanditsev, A. S.Shikanov, V. P.Silin, G. V.Sklizkov, V. T.Tikhonchuk, A. A.Zozulya. Investigation of generation of the 3/2
[44] H. C.Barr, P. D.Carter, R. G.Evans, S. M. L.Sim. Time resolved observations of the three-halves harmonic spectrum from laser-produced plasma. Phys. Rev. Lett., 44, 1407(1980).
[45] R. L.Berger, L. V.Powers. Emission of light at half‐integer harmonics of the laser frequency. Phys. Fluids, 28, 2895(1985).
[46] T. J.Awe, B. S.Bauer, S.Fuelling, I. R.Lindemuth, R. E.Siemon. Experimental investigation of thermal plasma formation from thick aluminum surfaces by pulsed multimegagauss magnetic field. Phys. Plasmas, 17, 102507(2010).


Set citation alerts for the article
Please enter your email address

© Copyright 2018-2021 | Chinese Laser Press. All Rights Reserved 沪ICP备15018463号-20