
Zongbao Shen, Chuang Li, Pin Li, Lei Zhang, Xiao Wang, Huixia Liu. Preparation of a Hydrophobic Copper Surface with Excellent Aging Properties Using Laser Shock Imprinting[J]. Laser & Optoelectronics Progress, 2022, 59(17): 1714006
- Laser & Optoelectronics Progress
- Vol. 59, Issue 17, 1714006 (2022)
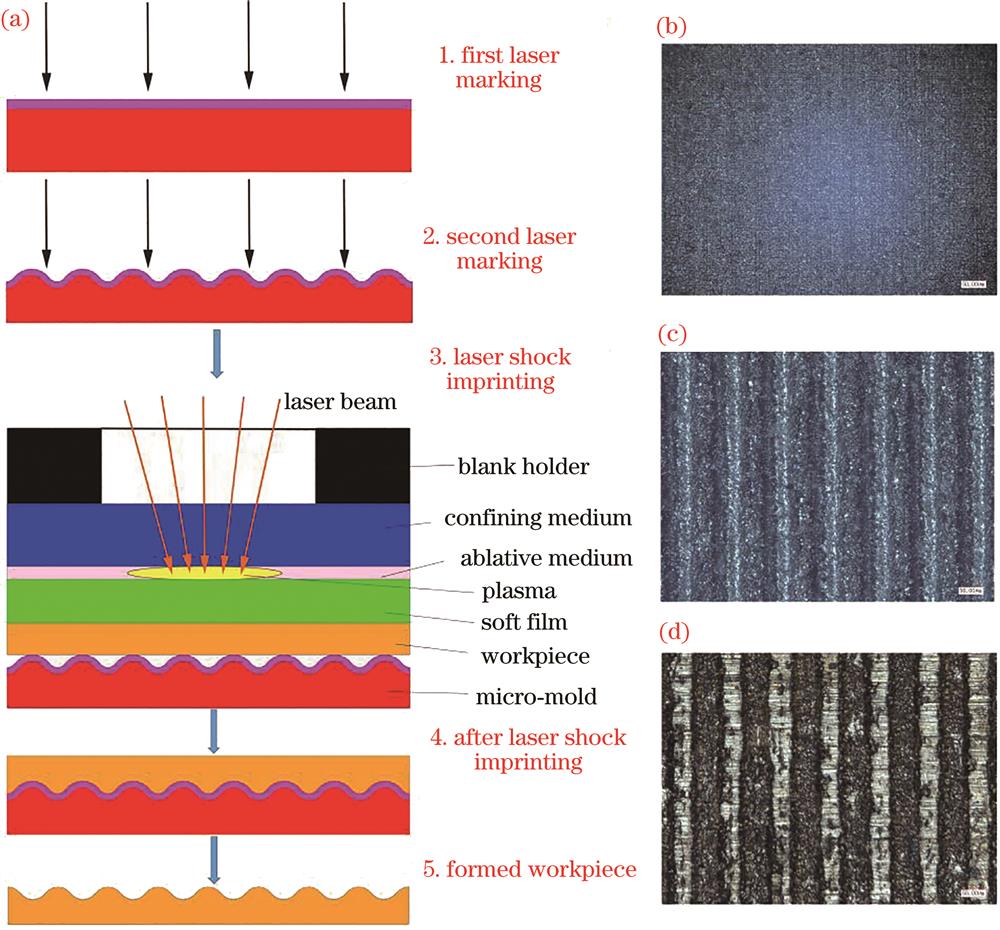
Fig. 1. Schematic diagram of LSI process. (a) Whole process diagram; (b) three-dimensional topography of micro-mold after first laser marking; (c) three-dimensional topography of micro-mold after second laser marking; (d) three-dimensional topography of workpiece surface after LSI
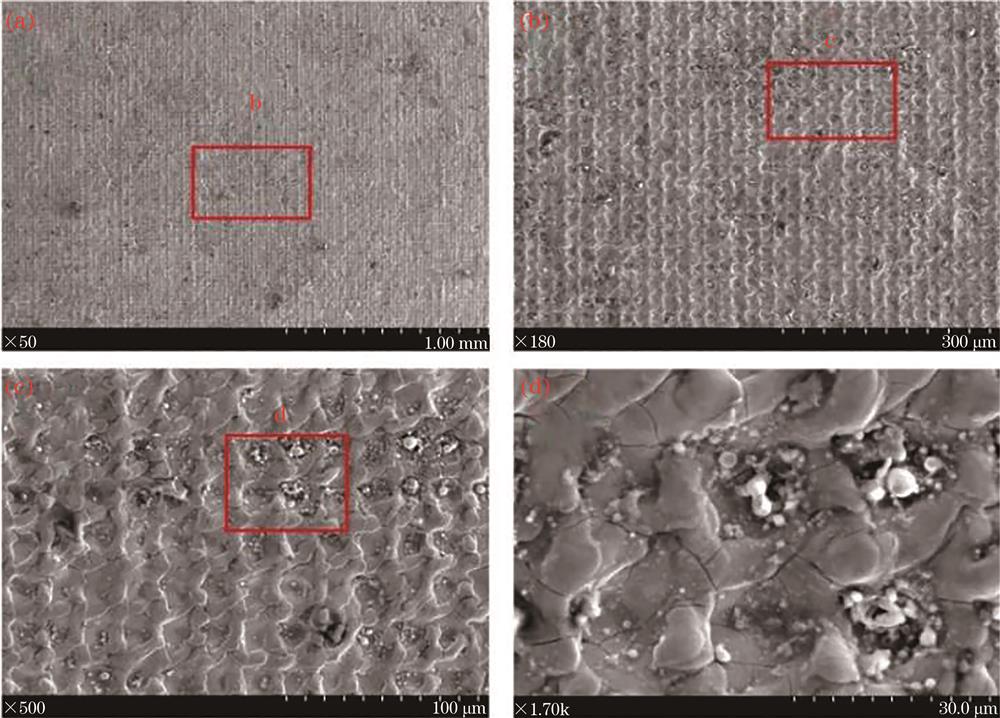
Fig. 2. SEM images of micro-mold surface after the first marking
Fig. 3. SEM images of groove microtexture on the surface of micro-mold after the second marking
Fig. 4. SEM images of workpiece forming surface under different shock times
Fig. 5. Variation of forming depth of workpiece forming surface under different numbers of shock times
Fig. 6. Variation of static contact angle of workpiece under different numbers of shock times
Fig. 7. Schematic diagram of workpiece surface wettability under different numbers of shock times. (a) Number of shock times is 1; (b) number of shock times is 7
Fig. 8. Forming effect of groove on workpiece surface under different soft film thicknesses. (a) Schematic diagram of groove selection; (b) variation of forming depth
Fig. 9. Variation of static contact angle of workpiece under different soft film thicknesses
Fig. 10. SEM images of workpiece forming surface under different soft film thicknesses
Fig. 11. Variation of contact angle of hydrophobic surface of workpiece with time in different chemical environments
Fig. 12. SEM images of hydrophobic surface of workpiece on the 1st, 3rd, 7th, 14th, and 21st days in NaCl solution
Fig. 13. SEM images of groove microtexture on the workpiece surface on the 21st day in air and water
| |||||||||||||||||||||||||||||||||||||||||||||||
Table 1. EDS of the top, bottom, and raw material area of the groove microtexture on the 1st and 21st days in 3.5% NaCl solution
| |||||||||||||||||||||||||||||
Table 2. EDS of workpiece groove microtexture on the 1st and 21st days in air and water

Set citation alerts for the article
Please enter your email address
© Copyright 2018-2021 | Chinese Laser Press. All Rights Reserved 沪ICP备15018463号-20