
Tianhao Zhu, Hui Zhou, Yan Shi, Qianyin Zhang. Parameter extraction method on the multiple mode waveforms of satellite laser altimeter(Invited)[J]. Infrared and Laser Engineering, 2022, 51(1): 20210836
- Infrared and Laser Engineering
- Vol. 51, Issue 1, 20210836 (2022)
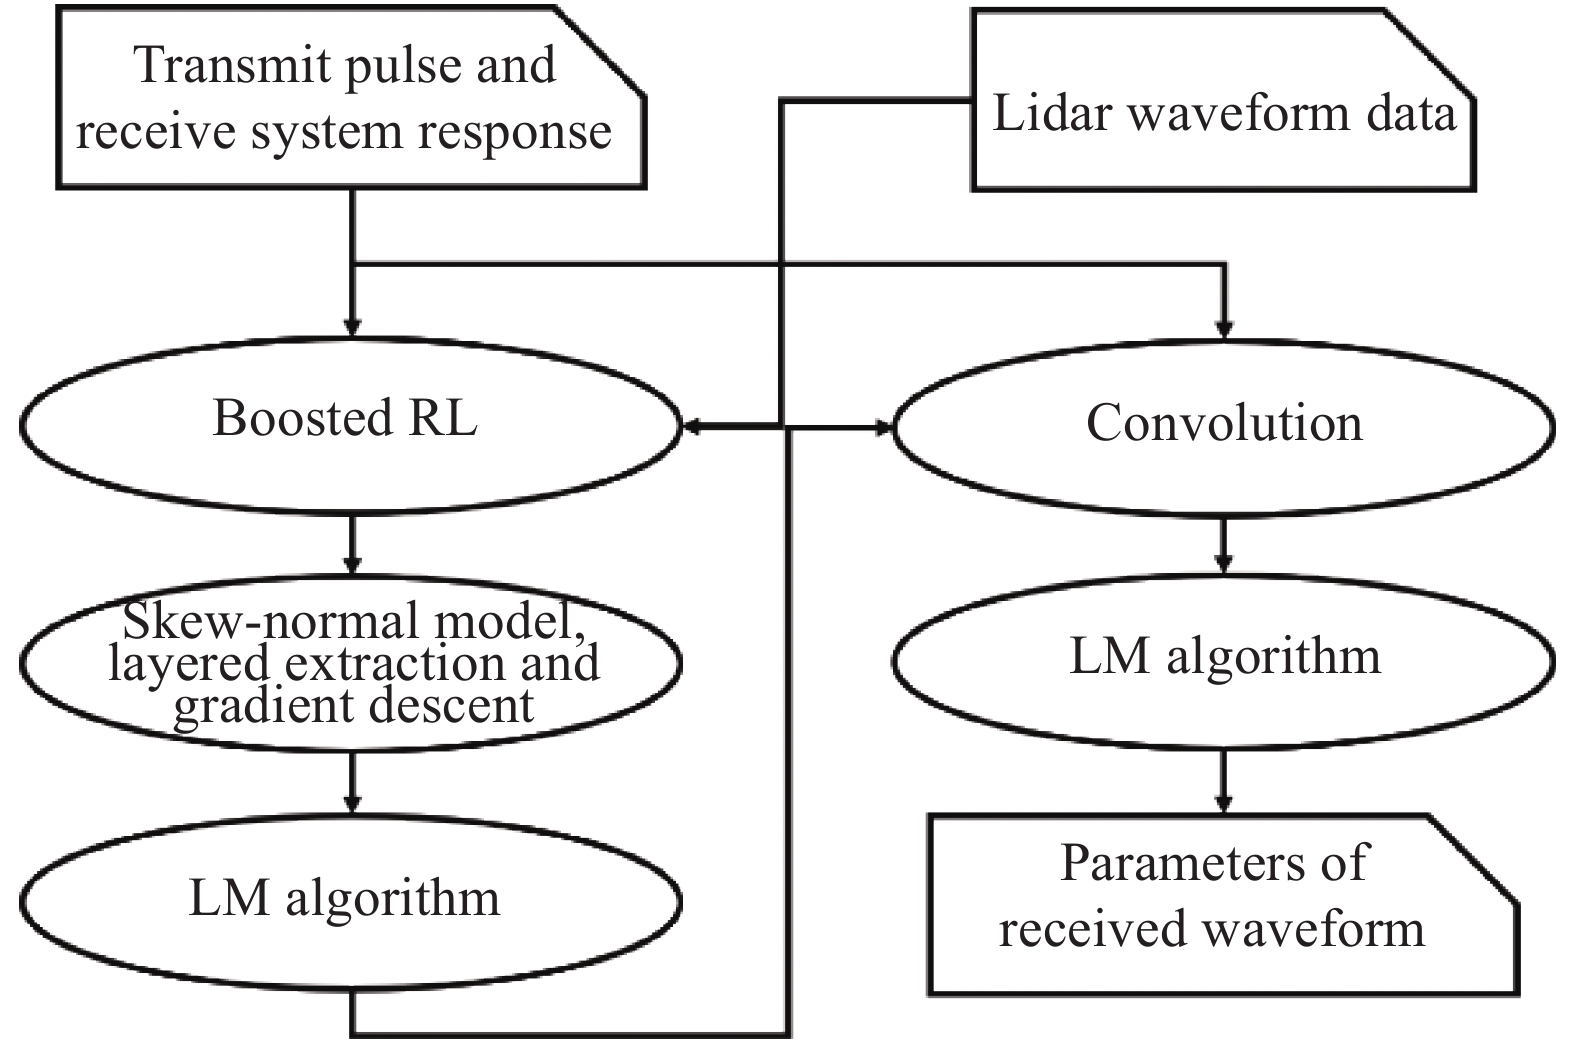
Fig. 1. Flow chart of the proposed method
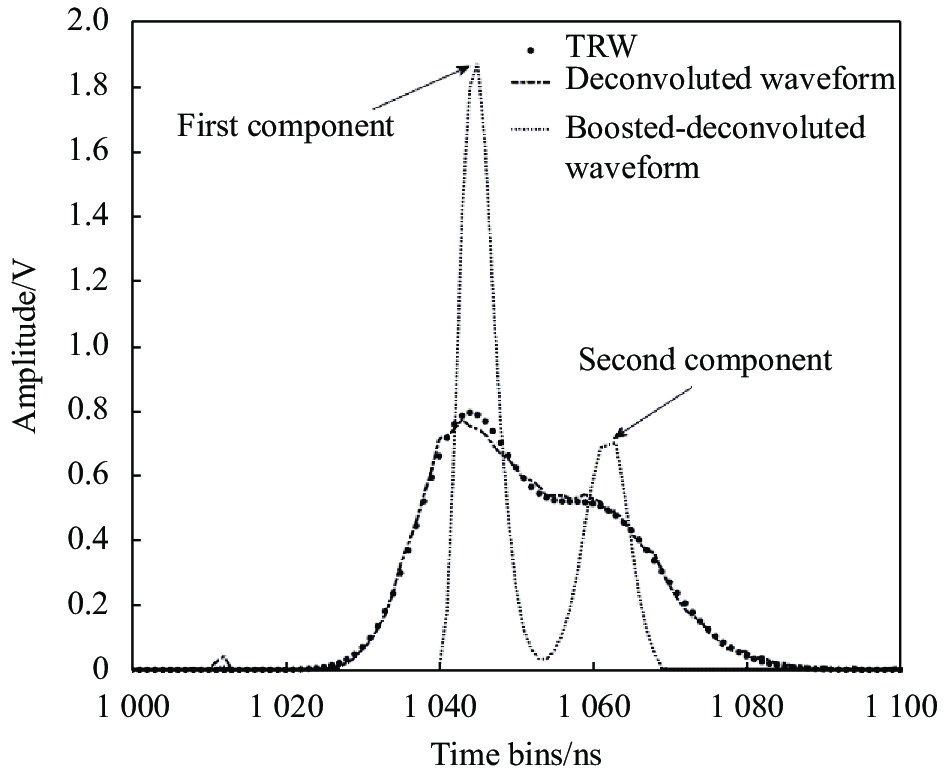
Fig. 2. Sketch map of extracting the peak positions and numbers of the target response waveform (TRW) based on the boosted RL deconvolution method
Fig. 3. Location of the study site and data trajectories of the GEDI and airborne lidar
Fig. 4. Prescribed parameter distributions of the known-parameter TRW and an example of the TRW
Fig. 5. Decomposed results of the received waveform by the DRET and DGDL methods
Fig. 6. The processed results of the known-parameter waveform data set obtained by the DRET and DGDL methods
Fig. 7. Extracted errors of the waveform parameters and the successful detection rates of the component numbers by the DRET and DGDL methods
Fig. 8. Decomposition results of airborne simulation data by the DRET and DGDL methods
Fig. 9. Decomposition results of the GEDI data by the DRET and DGDL methods
Fig. 10. Point cloud distributions of the vegetated target
Fig. 11. Distributions of the canopy height errors under different tree heights
|
Table 1. Parameter setting of known-parameter waveform data set
| ||||||||||||||||||||||||||||||||||||||||||||||||||||||||||||||||||||||||||||||||||||
Table 2. Detailed waveform parameters and evaluation indicators of the results extracted by the two methods
|
Table 3. Average value of the evaluation indexes of the two methods
| ||||||||||||||||||||||||||||||
Table 4. Correlation coefficient (
![]()
![]()
![]()
![]()
| ||||||||||||||||||||||||||||||
Table 5. Correlation coefficient (
![]()
![]()
![]()
![]()


Set citation alerts for the article
Please enter your email address

© Copyright 2018-2021 | Chinese Laser Press. All Rights Reserved 沪ICP备15018463号-20