
Han-Lu ZHU, Xu-Zhong ZHANG, Xin CHEN, Ting-Liang HU, Peng RAO. Dim small targets detection based on horizontal-vertical multi-scale grayscale difference weighted bilateral filtering[J]. Journal of Infrared and Millimeter Waves, 2020, 39(4): 513
- Journal of Infrared and Millimeter Waves
- Vol. 39, Issue 4, 513 (2020)
![[in Chinese]](/richHtml/hwyhmb/2020/39/4/513/img_1.png)
Fig. 1. [in Chinese]
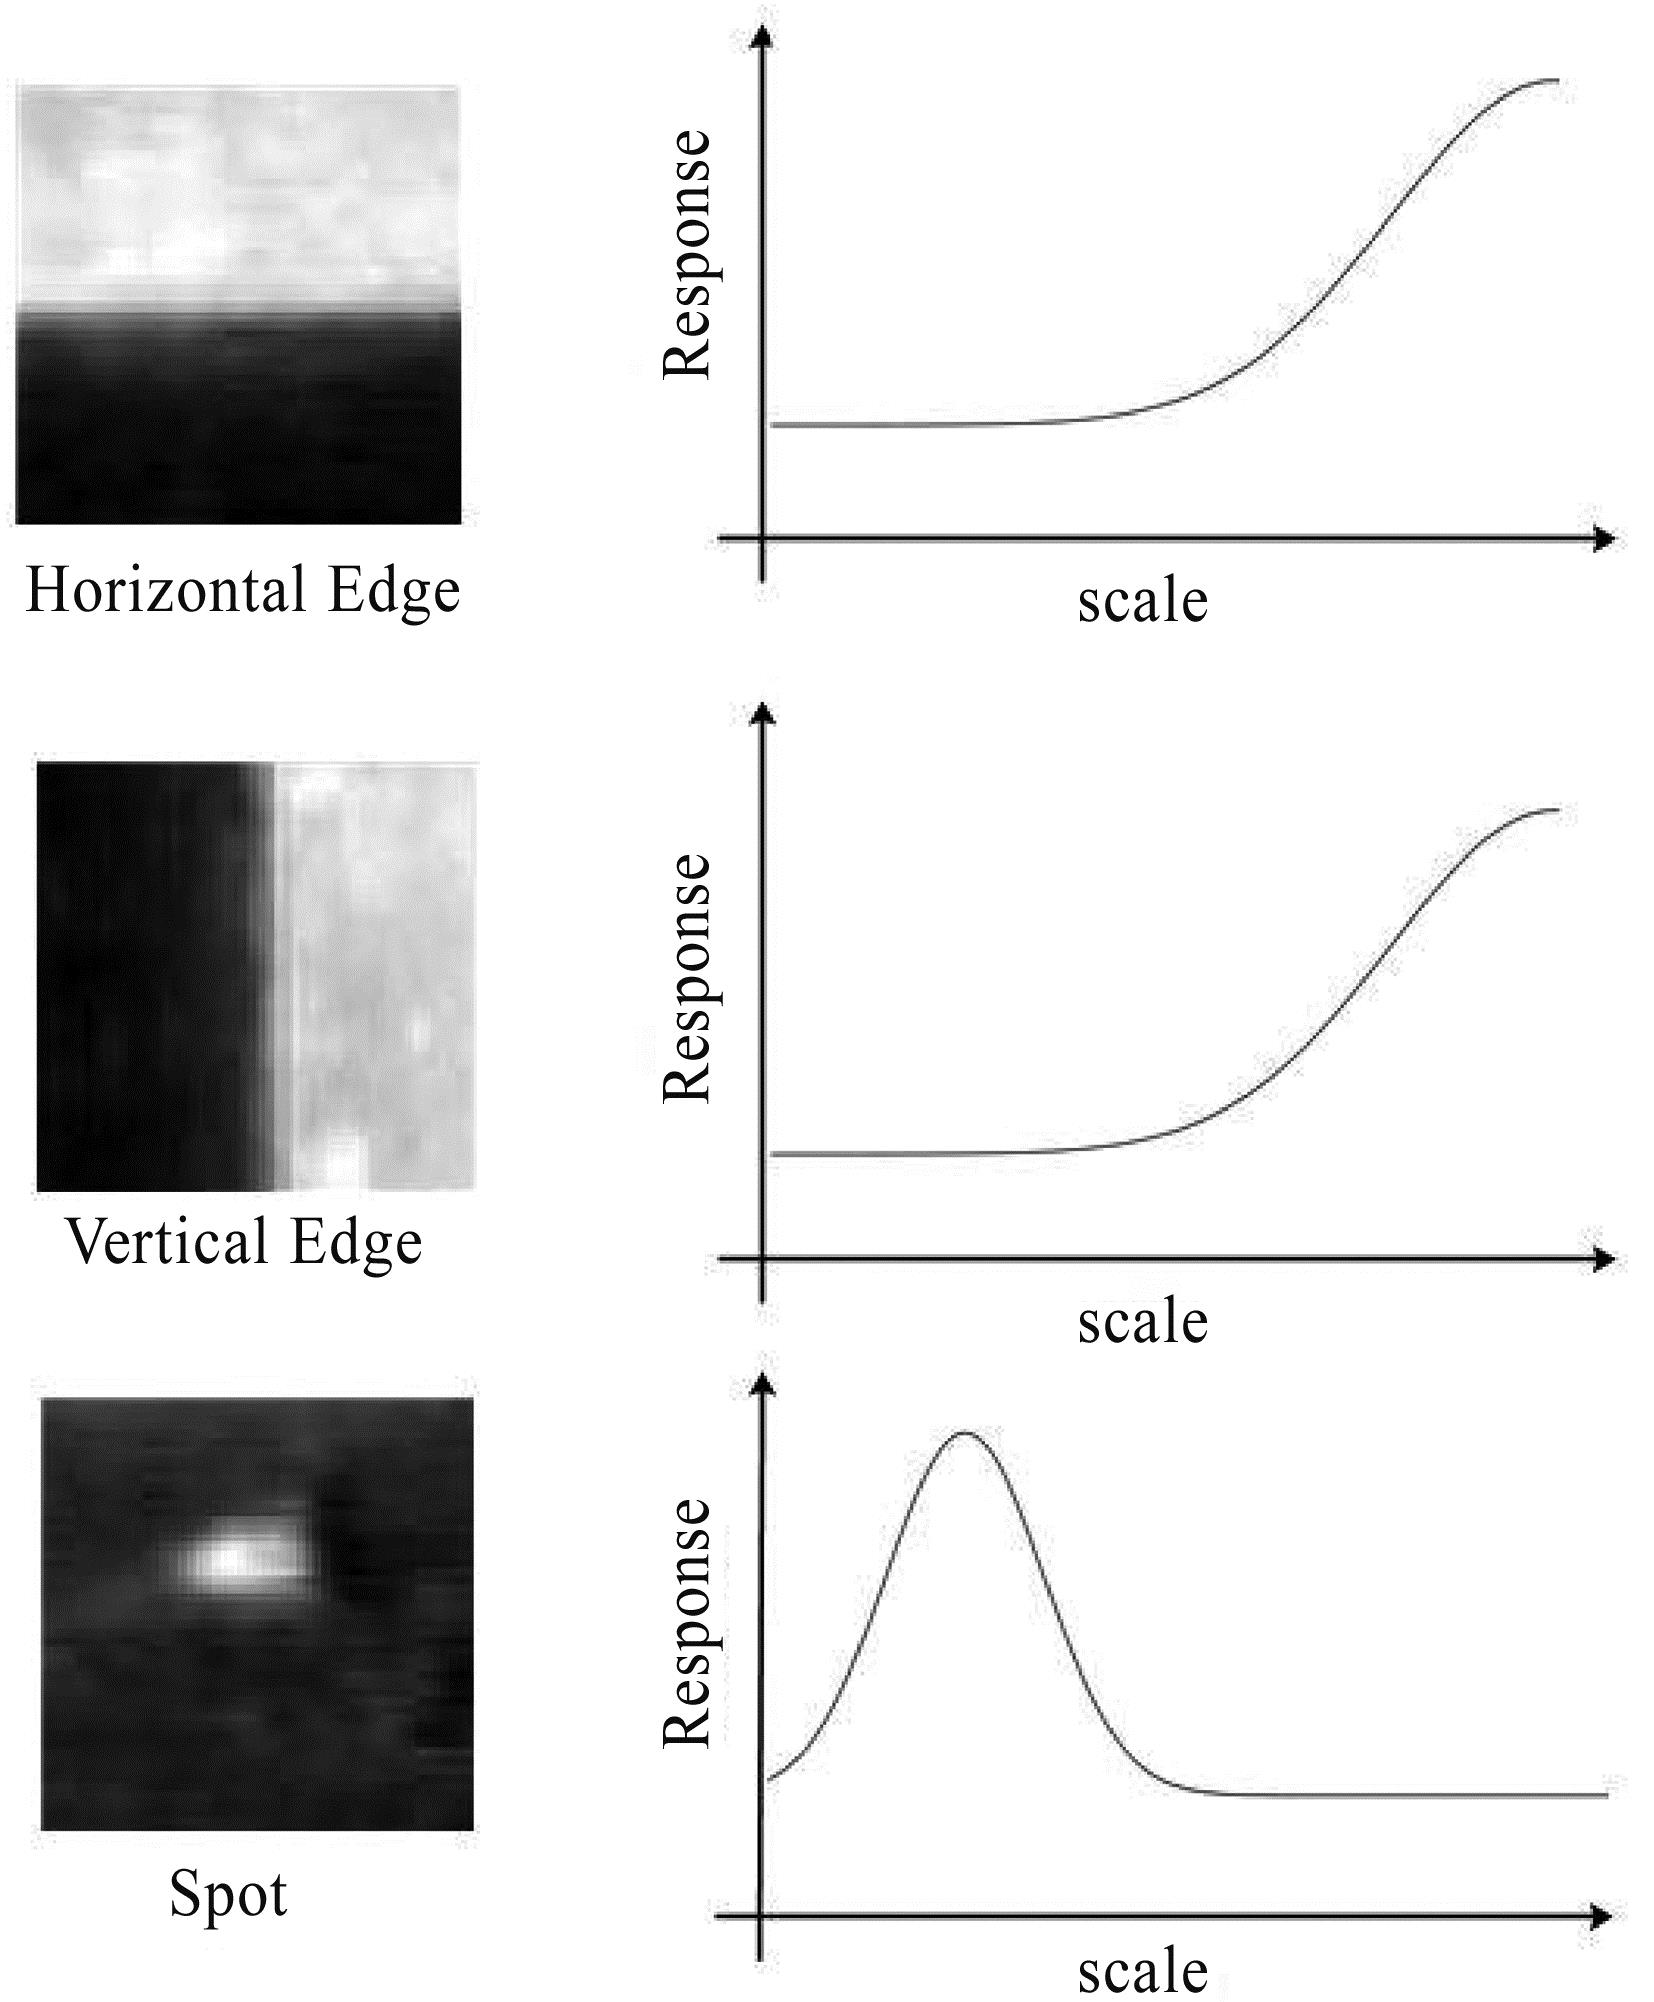
Fig. 2. The response of different boundaries at different scales
Fig. 3. calculate the HV-MSGD weighting operator
Fig. 4. The detection process of the entire dim small target
Fig. 5. Flow chart of trajectory detection
Fig. 6. the results of five images that processed by our method, (a) is the input image, (b) is the 3D view of the input image, (c) is the image processed by HV-MSGD, (d) is a 3D image processed by HV-MSGD, (e) is a threshold segmentation image processed by (c), (f) is a 3D threshold segmentation image processed by (c)
Fig. 7. Background suppression results of different algorithms in different scenarios (a) original image, (b) BF filtering result, (c) TDLMS filtering result in literature 15, (d) PM filtering result, (e) LCM filtering result of in literature 24, (f) NWIE, (g) filtering result of our method
Fig. 8. ROC of the five sequences
Fig. 9. Track of five sequences
Fig. 10. Histograms of detected bias pixels obtained by using our method (a) histograms of horizontal detected bias pixels of five sequences, (b) histograms of vertical detected bias pixels of five sequences
| ||||||||||||||||||||||||||||||||||||||||||||||||||||||||||||||||||||||||||||||||||||||||||||||||||||||||||||||||||||||||||||||||||||||||||||||||||||||||
Table 1. BSF and GSNR of different five images processed by different methods
| ||||||||||||||||||||||||||||||||||||||||||||||||||||||||||||||||||||||||||||||||||||||||||||||||||||||||||||||||||||||||||||||||||||||||||||||||||||||||||||||||||||||||||||||||||||||||||||
Table 2. the average of BSF and GSNR for five sequences
|
Table 3. AUC of five sequences in different algorithms

Set citation alerts for the article
Please enter your email address
© Copyright 2018-2021 | Chinese Laser Press. All Rights Reserved 沪ICP备15018463号-20