
Zhong-Hua HONG, Peng-Fei SUN, Ru-Yan ZHOU, Xiao-Hua TONG, Yong-Jiu FENG, Shi-Jie LIU. Fast mosaicking method of InSAR-generated multi-stripe digital elevation model[J]. Journal of Infrared and Millimeter Waves, 2022, 41(2): 493
- Journal of Infrared and Millimeter Waves
- Vol. 41, Issue 2, 493 (2022)
Abstract
Introduction
Interferometry synthetic aperture radar(InSAR)is the combination of the radio astronomical interference technology and SAR remote sensing technology. The InSAR technology has been widely used in the production and updating of global high-precision digital elevation model(DEM)products [
There is little variation in the DEM errors of the same stripe generated by InSAR technology. Owing to the difference in systematic error for the different stripes,there may be some situations such as the opposite error sign,which leads to the relative error between DEMs. In practice,the systematic error source of the overlapping area not only has an elevation error,but also a plane positioning error [
Tie-points are extracted for the appropriate DEM calibration steps. Huber et al. used the central point of the 1 × 1 km chip in the overlap area of adjacent DEMs as the tie-point [
The challenge of extended time requirements remains in existing large-scale multi-stripe DEM mosaicking methods. To overcome the limitation of poor processing time,a fast large-scale DEM mosaicking method based on the CPU/GPU asynchronous parallel construct was proposed,and the experiment was conducted on the TanDEM-X dataset. The experimental results showed that the efficiency of the mosaicking method proposed in this study is improved by more than 10 times,and seamless mosaicking was evaluated.
The remainder of this paper is organised as follows. Section 1 describes the large-scale multi-stripe DEM mosaicking method. Section 2 introduces the CPU/GPU parallel computing strategy. Section 3 verifies the effectiveness of the algorithm through experiments and presents the research results. Finally,conclusions are presented in Section 4.
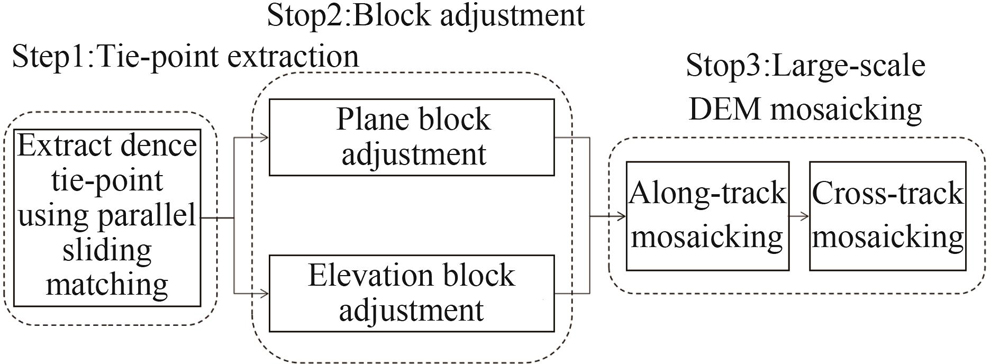
1 Large-scale multi-stripe DEM mosaicking method
The DEM error correction process depends on DEM geocoding,especially located in overlapping areas of the adjacent DEM. The two important steps primary affecting the output DEM mosaicking quality are registration and mosaicking [
![]()
Figure 1.Large-scale multi-stripe digital elevation model(DEM)mosaicking method
1.1 Dense tie-point extraction
The tie-point,as the input of the DEM block adjustment,is located in the overlapping area of the adjacent DEMs. Because noise degrades the quality of each DEM toward the edge,the tie-point should be located in the centre of the overlap area. Owing to different DEM parameter corrections,some initial positioning errors of the DEM are large. In this study,a matching strategy from rough to fine was adopted to obtain accurate coordinates of the tie-point. Among them,the normalised cross correlation function is used for rough matching because it has good noise resistance. In the process of rough matching,down sampling TanDEM,having the same resolution as SRTM DEM,is registered to the Shuttle Radar Topography Mission(SRTM)over a larger range. And positioning errors between TanDEM can be effectively controlled within a small range. The next fine matching can better extract high-precision tie-points. In the fine matching process,the position of the overlapping area was determined,and the centre of the overlapping region was calculated in advance. The uniformly-spaced tie-point coordinates was calculated using the information. The extraction of high-precision tie-points can be used for DEM error correction. In this study,a dense tie-point extraction method was adopted to obtain precise high-precision tie-points. High-precision tie-points can improve the accuracy of multi-stripe DEM error correction. The process of efficient tie-point extraction is illustrated in
![]()
Figure 2.Processing flow of digital elevation model(DEM)multi-stripe matching
The DEM features include elevation,slope,and texture,among which elevation information is the most direct display of DEM topographic information. In the overlap area,the chips were divided according to a certain interval and size. The chips were divided into square areas within the overlap area,and the sliding matching region was the square area set by the data parameters. The tie-point extraction method using an area-based matching approach was adopted to register the chips in the adjacent DEM as shown in
![]()
Figure 3.Chips partition and sliding matching
In the process of loading DEM data,the ignored value of the data is loaded at the same time. To avoid affecting the accuracy of the extraction tie-point,this study assessed the validity of the data chip elevation data before tie-point matching. The positioning errors of the two data chips were corrected by sliding matching of the data chips in the overlap area. The matching measure function adopted a relatively robust and efficient standard deviation of the elevation difference and is described in
where the original data chip is denoted as I,the data chip to be matched is T,the average value of the elevation difference between I and T is u,and represents the pixel of the data chip,(i,j)is the sliding position of the data chip,and w and h are the width and height of the data chip to be matched,respectively.
To further improve the accuracy of the extraction tie-point,the fitting surface minimum of the adjacent eight pixels corresponding to the data chip elevation difference standard deviation,and bilinear interpolation is performed to obtain the elevation value of the sub-pixel coordinate tie-point. The affine model was constructed using the obtained pairs of tie-points,and the outliers were screened with the root mean square error to obtain high-precision pairs of tie-points.
1.2 DEM block adjustment
The elevation error of the DEM adjustment method trajectory system is used to meet the required elevation accuracy for the quality evaluation of tie-point extraction,in addition to the visual interpretation method. Using the plane constraint of the tie-point and the elevation constraint of the elevation control point,plane block adjustment and elevation block adjustment are performed,respectively.
1.2.1 Plane block adjustment
The geographic coordinates of each pixel are determined by the geodetic coordinates of the corner points according to the pixel resolution,and its model is shown in
The plane coordinates of each DEM were adjusted according to the six-parameter affine transformation model.(x,y)are the coordinates of the tie-point. Taking the pair of tie-points matched by two stripes DEM as an example,stripe J is the matching DEM,stripe K is the reference DEM,and constraints are generated through the consistency of geographic coordinates of the tie-points. The matrix form of the error equation is obtained,and the coefficient of error correction model is obtained using the least squares principle to eliminate the plane coordinate system error of each DEM.
1.2.2 Elevation block adjustment
The objective of DEM block adjustment is to estimate the elevation error of the system to meet the required elevation accuracy. The elevation system error mainly has vertical displacement and inclination,and the systematic error can be approximated by a third-order polynomial. The error correction model for elevation adjustment is introduced in
where g(x,y)is the elevation error correction equation of the stripe,and(x,y)are the coordinates of the tie-points or GCPs.
After the matrix form of the error equation is obtained,the coefficient of error correction model can be obtained using the least squares principle,and the systematic error of the elevation direction of each DEM can be eliminated.
1.3 DEM mosaicking
After correcting the systematic errors of plane and elevation through block adjustment,the adjacent DEM generated by InSAR,especially in the overlapping area of the DEM,ensures continuity in the plane and elevation directions. According to the orbital direction of the satellite image,the multi-stripe DEMs in the given region of interest are first fused one by one in the along-track direction. The large-scale along-track DEMs are fused one by one in the cross-track direction. Finally,as shown in
![]()
Figure 6.Schematic diagram of digital elevation model(DEM)mosaicking strategy
The feathering-based mosaicking method determines the weight value of the mosaicking elevation based on the distance from the cell to the boundary of the overlap area. By obtaining the weight value used to adjust the cell elevation value in the overlap area,a large range of seamless mosaicking DEM was obtained.
2 Parallel computing strategy
Currently,the improvement in algorithm steps and algorithm performance can improve the efficiency of tie-point extraction to a certain extent;however,improving the efficiency of data processing by reducing the matching accuracy is not desirable. Therefore,based on ensuring the matching accuracy of tie-points,this study also improves the efficiency of tie-point extraction by improving the performance utilisation of hardware. This paper proposes a sliding matching algorithm that combines nested parallel computing of a hybrid CPU and GPU. The multi-threaded CPU is responsible for logical tasks,including data preparation. Parameter setting,video memory allocation,and initialisation,in addition to some tasks with a small amount of computation are also processed by the CPU,whereas the GPU is responsible for processing tasks with a large amount of computation and a high degree of parallelism. The process is illustrated in
![]()
Figure 7.Collaborative execution process of CPU and GPU after performance optimization
The tie-points can only be extracted in the overlap area. The CPU processes logical tasks fast. the positions of all overlap areas can be calculated by parallel processing of the multi-threaded CPU. GPU processes image tasks fast. GPU parallel processing is used to extract tie-points in each overlapping area. Hybrid nested GPU parallel computing in each CPU thread of computational overlap area. The images are loaded into GPU global memory. The corresponding standard deviations are calculated to carry out sliding matching,according to the position division of matching connection points. The coordinates of the images corresponding to the tie-points are calculated. The coordinates of the tie-points are loaded back from GPU global memory.
2.1 CPU nested parallel computing model based on OpenMP
In the CPU parallel computing model,a nested parallel processing algorithm based on the OpenMP compiler is proposed to improve the efficiency of tie-point extraction by simultaneously processing the matching process of multiple tie-points in multiple overlapping regions.
OpenMP uses the fork-join parallel execution mode,which includes the main thread and worker thread. When a thread is already running in a parallel region and comes across another parallel region,a new thread group is generated according to the rules of dynamic threads to execute the nested parallel region. In the process of extracting tie-points,N overlap areas can be separately compiled into N individual tasks using the OpenMP compiler. The compiler produces N worker threads(such as T1,T2,
![]()
Figure 8.Flowchart of CPU parallel computing overlap area
![]()
Figure 9.Tie-point matching flow chart of CPU parallel computing
2.2 Cuda-based GPU parallel computing model
Among GPU parallel computing models,CUDA is a general-purpose parallel computing architecture from NVIDIA in 2007. It includes a complete solution for GPU computing,which can efficiently accelerate the processing of complex computing on NVIDIA series graphics cards. A multi-core GPU comprises multiple streaming multiprocessors,each of which comprises multiple streaming processors. During execution,threads are organised into thread blocks and scheduled for execution by a thread block.
In the basic framework structure of the GPU,the parallelism of the tie-point extraction process focuses on the parallelism of the slide matching calculation of the tie-point. The slide matching algorithm of tie-points in the overlapping areas is compiled on CUDA. The matching process of the algorithm is simple to map to the GPU for processing,as shown in
![]()
Figure 10.GPU parallel computing architecture
The sliding matching algorithm includes linear interpolation and solving equations of multiple variables;therefore,the parallel computing model of the CPU can also be used to complete the sliding matching operation of the tie-point.
3 Results and discussions
In this section,the experimental results of large-scale and rapid DEM mosaicking are presented,and their accuracy is evaluated. To verify the effectiveness of the DEM mosaicking method,experiments were conducted with the TanDEM-X dataset,and the corresponding ICESat laser control points were used as GCPs for DEM block adjustment. Large-scale DEM mosaicking was performed.
The experiment was conducted using c++ 11 compiled on VS2017. The GDAL library was used to process the data and test the complete code on a computer configured with i9-10920xCPU,RTX2080Ti,and 64GB of memory.
3.1 Experimental data
3.1.1 Dataset
The robustness of the proposed method was evaluated. The experimental dataset is listed in
| TanDEM-X | 4 | 12 | 6588 | 8 |
Table 2.
The SRTM DEM,based on the C-band InSAR,was developped by a partnership between NASA,NGA and the German and Italian space agencies. Several dataset versions were available. In this study,the latest version of SRTM 4(SRTM DEM4)released by the Space Alliance,distributed in tiles with a spatial resolution of 5° × 5° and available on the CGIAR-CSI website,was used to splice the SRTM into a wide range of DEMs using ENVI software as a reference DEM for rough matching.
Topographic map of the study area based on the 90m SRTM DEM,as shown in
![]()
Figure 11.Slope map of study area.
3.1.2 ICESat dataset and control point selection
The ICESat spaceborne laser altimeter data provides the accurate altitude information,classification information and performance evaluation of measuring points distributed around the world [
3.2 Experiments
3.2.1 Dense tie-point extraction
Tie-point extraction is the first step in large-scale rapid DEM mosaicking,and its accuracy greatly affects the accuracy of subsequent block adjustment and mosaicking. This study uses the sliding matching method to extract the tie-points,which is different from feature matching method. And sliding matching is the most time-consuming part of tie-point extraction. A total of 401 tie-points pairs were extracted from the TanDEM-X DEM overlaps. Point pairs are shown in green and red,where the main tie-poinnts of point pairs are shown in red and the tie-points matched are shown in green,(
![]()
Figure 12.Distribution of tie-points
The CPU/GPU asynchronous parallel method was adopted for the tie-point extraction step. The advantages of CPU/GPU asynchronous parallel were demonstrated by comparing the time consumed with the use or not of CPU/GPU asynchronous parallel,as shown in
| 655.2 | |
| 37.59 |
Table 3. Comparison of parallel acceleration time
The corresponding ICESat laser points were obtained based on the TanDEM-X data obtained from InSAR. By setting a grid with a resolution of 20 pixels(160 m),311 uniform high-quality laser elevation control points in the region of interest were obtained. As shown in
![]()
Figure 13.ICESat laser points(red)superimposed on a TanDEM-X grid image
3.2.2 Block adjustment
Combined with the extracted tie-points and laser points,joint block adjustment was performed. The adjustment results were evaluated using 60 ICESat laser check points that were different from the elevation control points. The results are listed in
| Before block adjustment/m | After block adjustment/m | |
|---|---|---|
| ABS | 23.613 534 | 4.014 245 |
| RMSE | 3.529 182 | 1.144 294 |
| MAX | 90.097 908 | 46.479 540 |
| MIN | 9.036 408 | 0.034 023 |
Table 4. Comparison of check points and digital elevation model(DEM)elevation residuals before and after adjustment
The root mean square error of the elevation residual between the check points and the DEM decreased considerably,from 3.5 m to 1.1 m. This shows that the DEM systematic error was well corrected by the block adjustment,as shown in
![]()
Figure 14.TanDEM-X grid image after block adjustment
Resampling after block adjustment is also a time-consuming step of DEM mosaicking. The efficiency can be greatly improved by CPU parallel computing based on OpenMP,because TanDEM resampling are independent of each other. The results of CPU acceleration are shown in
| 163.7 | |
| 18.5 |
Table 5. Comparison of resampling parallel acceleration time
3.2.3 Large-scale DEM mosaicking
The plane and elevation errors in the DEM overlap areas were corrected by a considerable extent after block adjustment. As the difference in the DEM in the along-track direction is smaller than that in the cross-track direction,combined with the feathering-based blend method,the mosaicking strategy of first along-track followed by cross-track was adopted for large-scale DEM mosaicking. The mosaicking results are shown in
![]()
Figure 15.Large-scale TanDEM-X mosaicking image
4 Conclusions
In this study,a fast DEM mosaicking method was proposed. Dense tie-points were extracted from adjacent DEM overlap areas by allocation of the matching strategy. Combined with the corresponding ICESat elevation control points,block adjustment was performed to estimate the error parameters of the plane and elevation,respectively. Geometric continuity in the plane and elevation directions for TanDEM-X was maintained. A large-scale mosaicking was performed. The experimental results show that the fast DEM mosaicking method created a seamless large-scale multi-stripe DEM mosaicking from the TanDEM-X input DEM scenes. The CPU/GPU parallel acceleration strategy was used to improve the processing efficiency by nearly 18 times.
The executable file of the program available online(https://github.com/zhhongsh/Fast-Mosaicing-of-InSAR-generated-DEM).
References
[1] D B Gesch, J P Muller, T J Farrugia. The shuttle radar topography mission - Data validation and applications. Photogramm Eng Remote Sens, 72, 233-235(2006).
[4] P Fu, P M Rich. A geometric solar radiation model and its applications in agriculture and forestry, 357-364(2000).
[6] Qing-Song WANG. Research on high-efficiency and high-precision processing techniques of spaceborne interferometric synthetic aperture radar(2011).
[7] Lin-Wei YUE. Research on DEM fusion blending multi-source and multi-scale elevation data(2017).
[11] M Elmiro, L V Dutra, J C Mura. Calibration of interferometric synthetic aperture radar digital elevation models (DEM) using error surface interpolation methods(2006).
[12] D S Jain, C V Rao, S R Kumar et al. Assessment of DEM mosaic accuracy. Int Arch Photogramm Remote Sens, 37, 1137-1141(2008).
[19] M Huber, B Wessel, D Kosmann et al. Ensuring globally the TanDEM-X height accuracy: Analysis of the reference data sets ICESat, SRTM and KGPS-tracks, 769-772(2009).


Set citation alerts for the article
Please enter your email address

© Copyright 2018-2021 | Chinese Laser Press. All Rights Reserved 沪ICP备15018463号-20