
Jiangbo Chen, Yachao Zhang, Xiaozhen Li, Jingyi Zhu, Dengfeng Li, Shengliang Li, Chun-Sing Lee, Lidai Wang, "Confocal visible/NIR photoacoustic microscopy of tumors with structural, functional, and nanoprobe contrasts," Photonics Res. 8, 1875 (2020)
- Photonics Research
- Vol. 8, Issue 12, 1875 (2020)
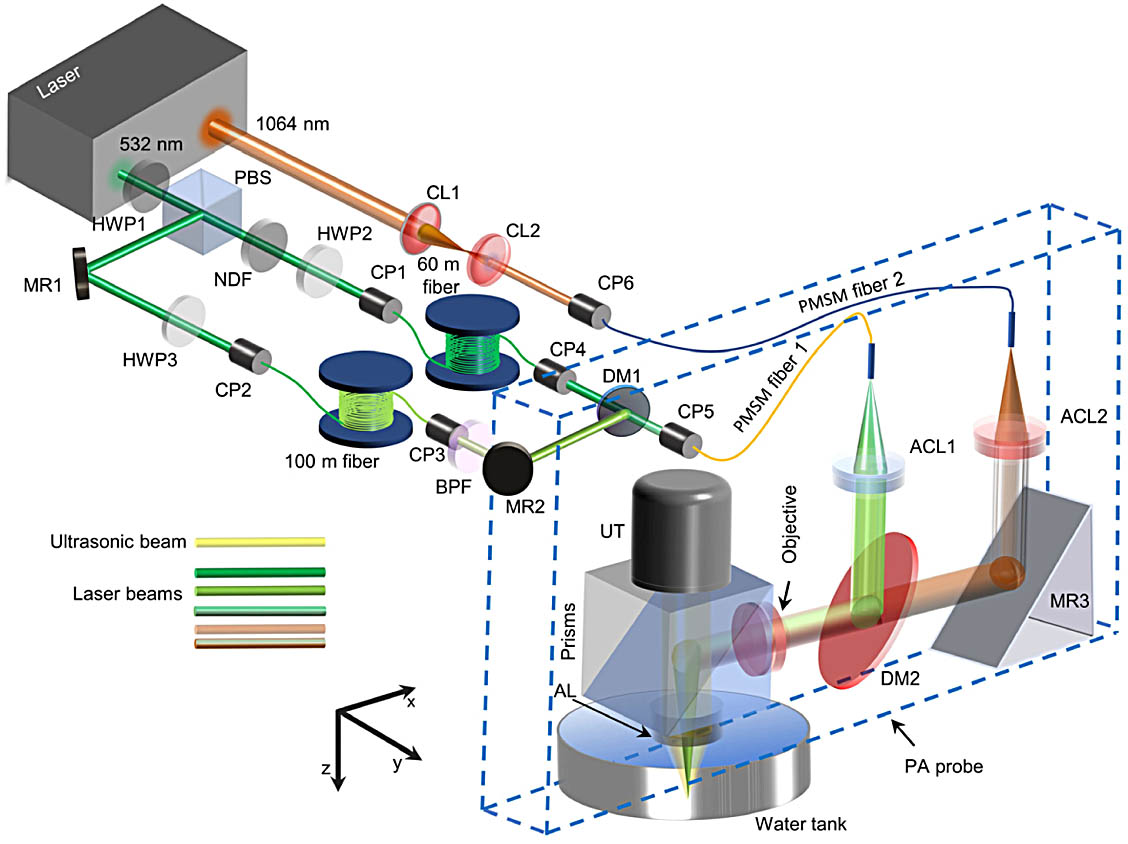
Fig. 1. Schematic of the CVN-PAM. ACL, achromatic lens; AL, acoustic lens; CL, convex lens; BPF, bandpass filter; CP, coupler; DM, dichroic mirror; HWP, half-wave plate; MR, mirror; NDF, neutral density filter; PBS, polarization beam splitter; UT, ultrasonic transducer.
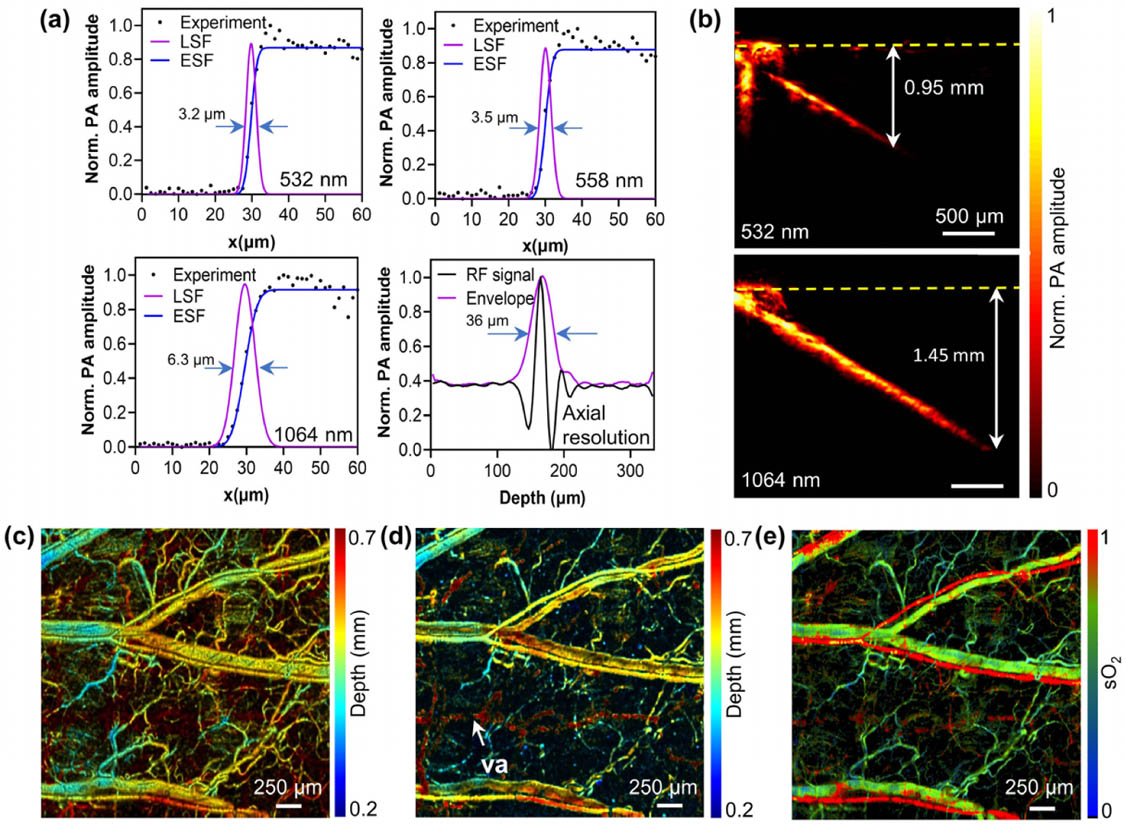
Fig. 2. (a) Measured and fitted edge spread function (ESF) and derived line spread function (LSF) at 532 nm, 558 nm, and 1064 nm; acoustic axial resolution. (b) Penetration depths, 0.95 mm for 532 nm and 1.45 mm for 1064 nm with a 6 dB SNR. (c) Depth-encoded vascular image of the mouse ear at 532 nm. (d) Depth-encoded vascular image of the mouse ear at 1064 nm. (e) sO 2
Fig. 3. (a) PA image of SPNs at 532 nm. (b) PA image of SPNs at 1064 nm. (c) PA image of blood at 1064 nm. (d) PA image of water at 1064 nm. (e) PA image of blood at 532 nm. (f) Comparison of average PA amplitudes of these samples. Error bars are standard deviations.
Fig. 4. (a) Mouse ear before injecting tumor cells (day 0). The black dotted box is the region of interest. (b) Microvasculature image of the mouse ear at 532 nm on day 0. (c) The color-coded depth microvasculature image of the mouse ear at 532 nm on day 0. (d) The mouse ear on day 6 (before injecting SNPs). (e) Microvasculature image of the mouse ear at 532 nm on day 6. (f) The color-coded depth microvasculature image of the mouse ear at 532 nm on day 6. (g) The mouse ear on day 7 (24 h after SPN injection). (h) Microvasculature image of the mouse ear at 532 nm on day 7. (i) The color-coded depth microvasculature image of the mouse ear at 532 nm on day 7.
Fig. 5. (a) The sO 2 sO 2 sO 2 sO 2 sO 2 sO 2 sO 2 x sO 2 sO 2 sO 2
Fig. 6. (a) Color-coded vessel tortuosity of the microstructure on day 0 and day 7. The extracted blood vessels are overlaid with the vessel centerlines. (b) Color-coded vessel diameter on day 0 and day 7. The extracted blood vessels are overlaid with the vessel centerlines. (c) Color-coded vessel density on day 0 and day 7. The image is divided into 40 × 34
|
Table 1. Vessel Parameters in Tumor and Non-Tumor Regions


Set citation alerts for the article
Please enter your email address

© Copyright 2018-2021 | Chinese Laser Press. All Rights Reserved 沪ICP备15018463号-20