Abstract
Distinguishing early-stage tumors from normal tissues is of great importance in cancer diagnosis. We report fiber-based confocal visible/near-infrared (NIR) optical-resolution photoacoustic microscopy that can image tumor microvasculature, oxygen saturation, and nanoprobes in a single scanning. We develop a cost-efficient single laser source that provides 532, 558, and 1064 nm pulsed light with sub-microseconds wavelength switching time. Via dual-fiber illumination, we can focus the three beams to the same point. The optical and acoustic foci are confocally aligned to optimize the sensitivity. The visible and NIR wavelengths enable simultaneous tumor imaging with three different contrast modes. Results show obvious angiogenesis, significantly elevated oxygen saturation, and accumulated nanoparticles in the tumor regions, which offer comprehensive information to detect the tumor. This approach also allows us to identify feeding and draining vessels of the tumor and thus to determine local oxygen extraction fraction. In the tumor region, the oxygen extraction fraction significantly decreases along with tumor growth, which can also assist in tumor detection and staging. Fiber-based confocal visible/NIR photoacoustic microscopy offers a new tool for early detection of cancer.1. INTRODUCTION
Early diagnosis and accurate removal of tumors are of great importance for cancer treatment [1–9]. In superficial tissue, the gastrointestinal tract, or during surgery, visual inspection, endoscopy, and other optical imaging techniques are often used in cancer screening or tumor edge detection. Because of poor contrast or low resolution, physicians may miss small tumors or inaccurately cut less diseased or healthier tissues [10–19].
Optical-resolution photoacoustic microscopy (OR-PAM) is a new biomedical technique for tumor imaging and is highly complementary to existing imaging modalities. In OR-PAM, focused optical excitation offers sub-cellular resolution and excellent sensitivity to optical absorption contrast [20–29]. OR-PAM can image microvasculature, oxygen saturation (), blood flow, and a variety of other endogenous and exogenous contrasts [30–38], offering valuable information for tumor detection. An important limitation is that most OR-PAM systems can only image one or two parameters at a time. Co-registered multi-contrast imaging can offer more comprehensive information for tumor detection. However, state-of-the-art OR-PAM must conduct repetitive scanning or even use different systems to acquire multiple contrasts, which is problematic for accurate co-registration and high-throughput imaging, especially for future clinical applications.
Here, we report fiber-based confocal visible/near-infrared (NIR) photoacoustic microscopy (CVN-PAM) that can image the tumor with structural, functional, and nanoprobe contrasts in a single scan. Based on a master oscillator power amplifier (MOPA) fiber laser, we develop a three-wavelength pulsed laser source for CVN-PAM. Via stimulated Raman scattering (SRS) and fiber-based optical delay, we have 532, 558, and 1064 nm wavelengths to image hemoglobin and nanoprobes. In the imaging probe, we use two single-mode fibers to deliver the visible and NIR light, respectively, so that we can align the three optical foci with the acoustic focus to maximize the sensitivity. We first characterize the system in phantom and in vivo experiments and then demonstrate the tumor imaging capability in a 4T1 breast cancer model. CVN-PAM enables simultaneous quantification of vessel density, angiogenesis, , oxygen extraction fraction (OEF), and nanoprobe concentration. We observe significant changes in all of these parameters, which offers rich information for early detection and staging of tumors.
2. CVN-PAM SYSTEM
Figure 1 shows a schematic of the CVN-PAM. A MOPA fiber laser (VPFL-G-20, Spectra-Physics) is used as the pump source, offering 1064 and 532 nm pulses. The 1064 nm beam is coupled into a 1.5 m polarization-maintaining single-mode (PMSM) fiber (HI1060, Corning). The 532 nm beam is split into two by a polarizing beam splitter (PBS). The energy ratio of the two beams is adjusted with a half-wave plate (HWP1). One 532 nm beam is coupled into a 60 m PMSM fiber (HB450-SC, Fibercore Limited) to delay it by 300 ns. HWP2 adjusts the incident polarization to suppress the SRS effect. The other 532 nm beam is coupled into a 100 m PMSM fiber to generate the 558 nm wavelength via the SRS effect and delay it by 500 ns. The fiber coupling efficiencies are above 50%. HWP3 is placed before the 100 m fiber to adjust the 558 nm efficiency. The delayed 532 nm beam is combined with the 558 nm beam using a dichroic mirror (DM1, T550lpxr-UF1, Chroma Technology) and coupled into a 2 m PMSM fiber (P1-460Y-FC, Thorlabs).
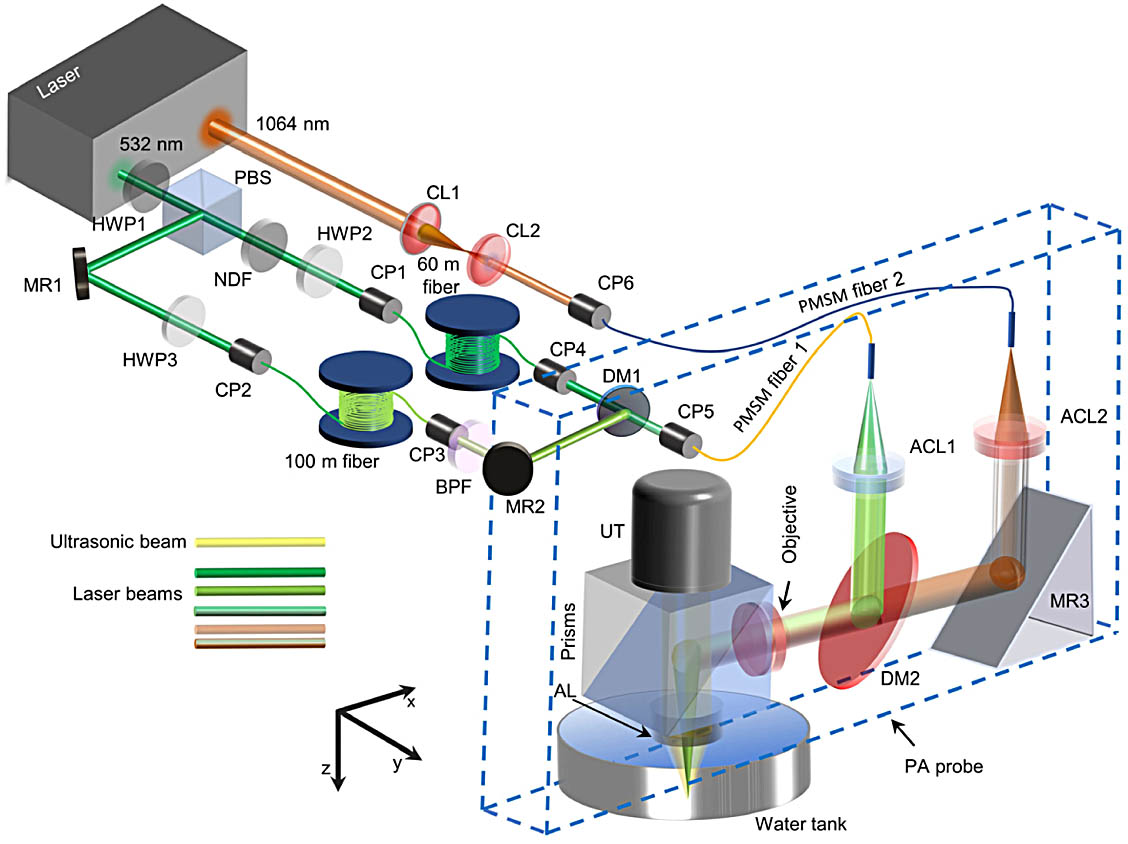
Figure 1.Schematic of the CVN-PAM. ACL, achromatic lens; AL, acoustic lens; CL, convex lens; BPF, bandpass filter; CP, coupler; DM, dichroic mirror; HWP, half-wave plate; MR, mirror; NDF, neutral density filter; PBS, polarization beam splitter; UT, ultrasonic transducer.
The 532/558 nm beam and the 1064 nm beam are connected to a photoacoustic (PA) imaging probe via PMSM fiber 1 and PMSM fiber 2, respectively. In the probe, the NIR and visible beams are first collimated by two achromatic lenses (AC064-013-A from Thorlabs and #33-202 from Edmund Optics). Then, they are combined via DM2 (#87-887, Edmund Optics) and focused by an achromatic objective (0.09 numerical aperture, #33-202, Edmund Optics). The focused beam is reflected in a cubic optical/acoustic beam combiner, transmitted through an acoustic lens (AL #45-697, Edmund Optics), and delivered to the sample. The excited acoustic wave is collected by the acoustic lens, transmitted through the optical/acoustic beam combiner, and received by a piezoelectric transducer (50 MHz center frequency, 78% bandwidth, V214-BC-RM, Olympus). The optical/acoustic beam combiner is made by bonding an aluminum-coated prism to an uncoated prism (#32-331 and #32-330, Edmund Optics). To minimize acoustic energy loss, the acoustic lens is glued to the optical acoustic beam combiner. The dual-fiber design allows us to finely tune the visible and NIR fibers independently so that we can align the visible and NIR foci with the acoustic focus to maximize the sensitivity of all three wavelengths. The ultrasonic signal is amplified by 48 dB (two ZFL-500LN+ amplifiers from Mini-Circuits) and digitized at 500 MHz using a high-speed data acquisition card (ATS9360, Alazar Technologies). Two linear stages (PLS-85, Physik Instrument) translate the PA probe in the and directions for raster scanning.
We measured the spatial resolutions for the visible and NIR wavelengths. PA signal profiles across a sharp edge of a stainless-steel sheet are measured to fit the edge spread functions (error functions). Deriving the edge spread function, we can obtain the line spread function and calculate its full width at half-maximum (FWHM). Figure 2(a) shows that the lateral resolutions for the visible and the NIR light are 3.2 μm (532 nm), 3.5 μm (558 nm), and 6.3 μm (1064 nm). To measure the axial resolution, we imaged a metal surface. As shown in Fig. 2(a), the FWHM of a Hilbert-transformed A-line is 36 μm, which matches the theoretical value of 34 μm (based on 1500 m/s speed of sound and 39 MHz bandwidth [39]). To measure the imaging depth, a segment of a tungsten filament of 250 μm diameter is obliquely inserted into chicken breast tissue as shown in Fig. 2(b). The 532 nm and 1064 nm images show 0.95 mm and 1.45 mm penetration depths with 6 dB SNR. To demonstrate in vivo imaging ability, we imaged blood vessels in the mouse ear. The pulse energy is 70 nJ for both the 532 nm and the 558 nm light and is 4.6 μJ for the 1064 nm light. If the optical focus is 0.5 mm below the tissue surface, the optical fluence will be and for the visible and 1064 nm wavelengths, within the American National Standards Institute (ANSI) safety limit (20 and for the visible and 1064 nm wavelengths). The time delays among the three pulses further guarantee that the combined three-wavelength excitation is still in the safety limit. Figures 2(c) and 2(d) show the depth-encoded microvascular images acquired with the 532 nm and the 1064 nm light. Because of strong absorption and tight focusing, the visible light can reveal more microvessels than the 1064 nm light. On the other hand, the 1064 nm light is less scattered than the visible light, and thus we can observe more deep vessels in the NIR image. For example, the vessel labeled as “va” in Fig. 2(d) can be imaged by the 1064 nm light but is barely visible in the 532 nm image. These results show that CVN-PAM can benefit from complementary resolution, sensitivity, and imaging depth. Figure 2(e) shows the microvasculature and imaged with the visible light [25].

Figure 2.(a) Measured and fitted edge spread function (ESF) and derived line spread function (LSF) at 532 nm, 558 nm, and 1064 nm; acoustic axial resolution. (b) Penetration depths, 0.95 mm for 532 nm and 1.45 mm for 1064 nm with a 6 dB SNR. (c) Depth-encoded vascular image of the mouse ear at 532 nm. (d) Depth-encoded vascular image of the mouse ear at 1064 nm. (e) image of the mouse ear computed from 532 nm and 558 nm wavelengths.
3. EXPERIMENTAL RESULTS AND DISCUSSION
We demonstrate that the new CVN-PAM system can provide comprehensive contrasts for in vivo early tumor detection. With the visible wavelengths, we can image the microvasculature and of the tumor without labeling; with the NIR wavelength, we can image nanoprobes with high sensitivity. We use semiconducting polymer nanoparticles (SPNs) [18] to enhance the tumor contrast. As shown in Fig. 3, we validate that the CVN-PAM can image both SPNs and blood with high sensitivity. The SPN concentration is 300 μg/mL. The surface fluences of the 532 nm and 1064 nm pulses are set to . SPNs have higher PA amplitude at 1064 nm, which is twice the blood amplitude at 1064 nm. The PA amplitude of the SPNs at 1064 nm is times the 532 nm one. Because the SPNs absorb 1064 nm light much stronger than blood, we can effectively separate the nanoprobe from the blood in the NIR imaging.
Figure 3.(a) PA image of SPNs at 532 nm. (b) PA image of SPNs at 1064 nm. (c) PA image of blood at 1064 nm. (d) PA image of water at 1064 nm. (e) PA image of blood at 532 nm. (f) Comparison of average PA amplitudes of these samples. Error bars are standard deviations.
In the in vivo experiment, the pulse energies are 70 nJ, 55 nJ, and 320 nJ for the 532 nm, 558 nm, and 1064 nm wavelengths. The pulse repetition rate (PRR) is 4 kHz for each wavelength. It takes to raster scan a area. In future work, the imaging speed can be improved via using a fast scanner, such as a microelectromechanical system (MEMS) mirror [20,40], a voice coil scanner [22], or a polygon scanner [25]. Mice of 10 weeks old were used in the experiment. The mice were anesthetized by inhaling 2% isoflurane air.
Before tumor implantation (day 0), the mouse ear was imaged with the three wavelengths. The photograph and the microstructure image are shown in Figs. 4(a) and 4(b). The arteries, veins, and microvessels can be resolved in Fig. 4(b). Figure 5(a) shows an image of the mouse ear. After the control imaging, 4T1 breast cancer cells (1 million cells in 20 μL PBS) were injected into the mouse ear. A small tumor became visible on day 6, as shown in Figs. 4(d) and 4(e). Then, we injected 150 μL SPNs (1042 μg/mL) into the caudal vein. In 24 h following the SPNs injection (day 7), we imaged the tumor on the mouse ear. As shown in Figs. 4(b) and 4(e), the tumor growth results in obvious vascular structural change. We can observe obvious vascular change and angiogenesis on days 6 and 7 in and around the tumor region. Compared with day 0, the PA amplitudes of vessels labeled as ‘vb,’ ‘vc,’ and ‘vd’ of the tumor area show an obvious increase on days 6 and 7, as shown in Figs. 4(b), 4(e), and 4(h). We also find the vessels, such as vessels labeled ‘ve’ and ‘vf,’ in the non-tumor area shrink and become less visible, as shown in Figs. 4(b), 4(e), and 4(h). Figures 4(c), 4(f), and 4(i) show color-coded depth microvasculature images of the mouse ear at 532 nm. The tumor growth results in the height change of the tumor area. The microstructure change of the mouse ear fits well with the visual mouse ear changes, as shown in Figs. 4(a), 4(d), and 4(g).
Figure 4.(a) Mouse ear before injecting tumor cells (day 0). The black dotted box is the region of interest. (b) Microvasculature image of the mouse ear at 532 nm on day 0. (c) The color-coded depth microvasculature image of the mouse ear at 532 nm on day 0. (d) The mouse ear on day 6 (before injecting SNPs). (e) Microvasculature image of the mouse ear at 532 nm on day 6. (f) The color-coded depth microvasculature image of the mouse ear at 532 nm on day 6. (g) The mouse ear on day 7 (24 h after SPN injection). (h) Microvasculature image of the mouse ear at 532 nm on day 7. (i) The color-coded depth microvasculature image of the mouse ear at 532 nm on day 7.
Figure 5.(a) The of the mouse ear before injecting cancer cells (day 0). (b) The of the mouse ear on day 7. (c) Extracted of the tumor region. The feeding vessels and draining vessels are pointed out. (d) Imaging of the mouse ear at 1064 nm on day 0 and day 7. (e) The combined image of and 1064 nm image. (f) The pixels percentage in the mouse ear on day 0 and day 7. The vertical axis is the percentage ratio of the pixel number at an value to the total pixel number of the blood vessels in the image. The value interval on the axis is 0.001. (g) The pixels percentage of R1 and R2 in the mouse ear on day 7. (h) The change of the feeding vessels and draining vessels. The OEFs of the tumor region are extracted from the values.
Figure 5(b) shows the image of the mouse ear with a tumor on day 7. Figure 5(f) compares the histograms on days 0 and 7. We can find that the in many vessels increased. For future clinical applications, tumor screening has to be performed without any available control reference. It is thus necessary to diagnose the tumor by comparing the tumor region with the non-tumor region. Therefore, we also compare the between the tumor region (R1) and the non-tumor region (R2) in Fig. 5(b). Figure 5(g) shows that there is only one peak at for R1. In R2, two peaks are located at 0.75 and 0.99. Angiogenesis causes dramatic changes in vessel structure. Figures 5(a) and 5(b) show that vessels labeled as “vg” and “vh” become draining veins (a draining vein is defined as a vein that drains the blood from the tumor [26,33]). Compared with day 0, the values of veins labeled as ‘ve’ and ‘vf’ in the non-tumor region decrease on day 7, as shown in Figs. 5(a) and 5(b). We extract the vessels in the tumor region according to the , which is higher than 0.8, as shown in Fig. 5(c). Three feeding arteries (a feeding artery is defined as an artery that supplies blood to the tumor [33,41]) and 16 draining veins can be identified. The average values of feeding vessels and draining vessels are shown in Fig. 5(h). The OEF [, where is the value of the feeding arteries and is the value of the draining veins [26]] can be calculated from the average values, as shown in Fig. 5(h). The OEF decreases obviously from 0.38 on day 0 to 0.02 on day 7. Figure 5(d) shows the 1064 nm images. Because of the low pulse energy and week blood absorption, the 1064 nm image (day 0) does not show clear vascular features. The SPNs show high PA intensity on day 7 due to the high optical absorption. We combine the and 1064 nm images in Fig. 5(e). The tumor can be distinguished from the background with high resolution. Because the vessels in the tumor are leaky [42,43], SPNs accumulate in the tumor body but not in the surrounding region. The vessels surrounding the tumor may have an abnormal microstructure and elevation due to the angiogenesis and hypermetabolism of the tumor. As shown in Fig. 5(e), the difference in the accumulated nanoparticle map and vascular map provides high-resolution information of the different types of vessels in and surrounding the tumor. The tumor is according to the SPNs image boundary, which is determined by 6 dB SNR. The feeding and draining vessels around the tumor are imaged at high resolution. The combined image offers comprehensive information for tumor diagnosis and therapy. CVN-PAM can be used to image tumors in superficial tissues, such as oral cancer on the mucosa or subcutaneous tumor models. It can also be used to detect or stage exposed tumors during surgery.
Angiogenesis is a hallmark of cancer. We analyze vessel tortuosity, vessel diameter, and vessel density. The vessel tortuosity is calculated as , where is the vessel path length, and is the linear distance between the two vessel ends. The vessel density of a subarea is computed from , where is the total PA amplitude pixel value of the subarea, and is the total PA amplitude pixel value of the region of interest. Figures 6(a) and 6(b) are the blood vessels extracted with a Hessian filter. The pseudocolor in Fig. 6(a) represents the vessel tortuosity. The pseudocolor in Fig. 6(b) represents the vessel diameter. To quantify the vessel density, the image is divided into subareas. As shown in Fig. 6(c), each subarea is color-coded with its vessel densities. We separate the tumor region (R3) from the non-tumor region (R4, the region except R3). The average vessel tortuosity, vessel diameter, and vessel density in the tumor and non-tumor regions are summarized in Table 1. In the tumor region, compared with day 0, the vessel tortuosity, vessel diameter, and vessel density increase dramatically on day 7. In the non-tumor region, compared with day 0, the vessel tortuosity and vessel density have no obvious change on day 7. The average vessel diameter in R4 decreases from 18.30 μm to 10.56 μm. On day 7, we find that the vessel tortuosity, diameter, and density are significantly higher in the tumor region than that in the non-tumor region.
Figure 6.(a) Color-coded vessel tortuosity of the microstructure on day 0 and day 7. The extracted blood vessels are overlaid with the vessel centerlines. (b) Color-coded vessel diameter on day 0 and day 7. The extracted blood vessels are overlaid with the vessel centerlines. (c) Color-coded vessel density on day 0 and day 7. The image is divided into subareas.
| Region | Time | Vessel Tortuosity (a.u.) | Vessel Diameter (μm) | Vessel Density (a.u.) |
| Tumor R3 | Day 0 | 1.06±0.05 | 18.20±3.60 | 0.51±0.04 |
| Day 7 | 1.21±0.11 | 28.40±5.10 | 0.81±0.13 |
| Non-tumor R4 | Day 0 | 1.08±0.06 | 18.30±3.64 | 0.49±0.05 |
| Day 7 | 1.07±0.08 | 10.56±4.25 | 0.55±0.08 |
Table 1. Vessel Parameters in Tumor and Non-Tumor Regions
4. CONCLUSION
We develop a three-wavelength (532, 558, and 1064 nm) laser source with 200 ns delay time. The visible and NIR laser beams are adjusted to be confocal in a dual-fiber PA imaging probe. CVN-PAM has two major advantages. One is that the visible and NIR light offers complimentary imaging contrasts of biological tissue. The other one is that the dual-fiber-based confocal probe effectively improves the sensitivity and scanning speed. CVN-PAM can image the microvasculature, , and NIR molecular/nanoprobes, providing comprehensive information for tumor diagnosis. We image a 4T1 tumor model with three contrast modes. Results show obvious angiogenesis, significantly elevated , and high-contrast nanoprobes in the tumor region. Vessel tortuosity, diameter, and density increase obviously when the tumor grows up. Feeding arteries and draining veins of the tumor can be identified from the tumor region. The of draining veins increases, and OEF of the tumor region decreases significantly. The CVN-PAM is a powerful tool in tumor diagnosis and pathological studies.
References
[1] F. A. de la Peña, R. Andrés, J. A. Garcia-Sáenz, L. Manso, M. Margelí, E. Dalmau, S. Pernas, A. Prat, S. Servitja, E. Ciruelos. SEOM clinical guidelines in early stage breast cancer (2018). Clin. Transl. Oncol., 21, 18-30(2019).
[2] F. Cardoso, S. Kyriakides, S. Ohno, F. Penault-Llorca, P. Poortmans, I. T. Rubio, S. Zackrisson, E. Senkus. Early breast cancer: ESMO clinical practice guidelines for diagnosis, treatment and follow-up. Ann. Oncol., 30, 1194-1220(2019).
[3] K. Anand, J. Roszik, D. Gombos, J. Upshaw, V. Sarli, S. Meas, A. Lucci, C. Hall, S. Patel. Pilot study of circulating tumor cells in early-stage and metastatic uveal melanoma. Cancers, 11, 856(2019).
[4] S. Cheraghlou, S. R. Christensen, G. O. Agogo, M. Girardi. Comparison of survival after mohs micrographic surgery vs wide margin excision for early-stage invasive melanoma. JAMA Dermatol., 155, 1252-1259(2019).
[5] C. Sompong, S. Wongthanavasu. An efficient brain tumor segmentation based on cellular automata and improved tumor-cut algorithm. Exp. Syst. Appl., 72, 231-244(2017).
[6] C. Yeh, L. Wang, J. Liang, Y. Zhou, S. Hu, R. E. Sohn, J. M. Arbeit, L. V. Wang. Early-stage tumor detection using photoacoustic microscopy: a pattern recognition approach. Proc. SPIE, 10064, 100644N(2017).
[7] A. Binte, E. Attia, G. Balasundaram, M. Moothanchery, U. S. Dinish, R. Bi, V. Ntziachristos, M. Olivo. A review of clinical photoacoustic imaging: current and future trends. Photoacoustics, 16, 100144(2019).
[8] S. Manohar, S. S. Gambhir. Clinical photoacoustic imaging. Photoacoustics, 19, 100196(2020).
[9] H. C. Zhou, N. Chen, H. Zhao, T. Yin, J. Zhang, W. Zheng, L. Song, C. Liu, R. Zheng. Optical-resolution photoacoustic microscopy for monitoring vascular normalization during anti-angiogenic therapy. Photoacoustics, 15, 100143(2019).
[10] W. Zhang, Y. Li, Y. Yu, K. Derouin, Y. Qin, V. P. Nguyen, X. Xia, X. Wang, Y. M. Paulus. Simultaneous photoacoustic microscopy, spectral-domain optical coherence tomography, and fluorescein microscopy multi-modality retinal imaging. Photoacoustics, 20, 100194(2020).
[11] Y. Duan, D. Hu, B. Guo, Q. Shi, M. Wu, S. Xu, X. Liu, J. Jiang, Z. Sheng, H. Zheng, B. Liu. Nanostructural control enables optimized photoacoustic-fluorescence–magnetic resonance multimodal imaging and photothermal therapy of brain tumor. Adv. Funct. Mater., 30, 1907077(2020).
[12] B. Guo, Z. Feng, D. Hu, S. Xu, E. Middha, Y. Pan, C. Liu, H. Zheng, J. Qian, Z. Sheng, B. Liu. Precise deciphering of brain vasculatures and microscopic tumors with dual NIR-II fluorescence and photoacoustic imaging. Adv. Mater., 31, 1902504(2019).
[13] G. S. Filonov, A. Krumholz, J. Xia, J. Yao, L. V. Wang, V. V. Verkhusha. Deep-tissue photoacoustic tomography of a genetically encoded near-infrared fluorescent probe. Angew. Chem. Int. Ed., 51, 1448-1451(2012).
[14] C. Liu, D. Wang, Y. Zhan, L. Yan, Q. Lu, M. Y. Z. Chang, J. Luo, L. Wang, D. Du, Y. Lin, J. Xia, Y. Wu. Switchable photoacoustic imaging of glutathione using MnO2 nanotubes for cancer diagnosis. ACS Appl. Mater. Interfaces, 10, 44231-44239(2018).
[15] N. Nyayapathi, J. Xia. Photoacoustic imaging of breast cancer: a mini review of system design and image features. J. Biomed. Opt., 24, 121911(2019).
[16] P. K. Upputuri, M. Pramanik. Recent advances in photoacoustic contrast agents for in vivo imaging. Wiley Interdiscip. Rev. Nanomed. Nanobiotechnol., 12, e1618(2020).
[17] W. Zhang, Y. Wen, D. X. He, Y. F. Wang, X. L. Liu, C. Li, X. J. Liang. Near-infrared AIEgens as transformers to enhance tumor treatment efficacy with controllable self-assembled redox-responsive carrier-free nanodrug. Biomaterials, 193, 12-21(2019).
[18] G. Wen, X. Li, Y. Zhang, X. Han, X. Xu, C. Liu, K. Chan, C.-S. Lee, C. Yin, L. Bian, L. Wang. Effective phototheranostics of brain tumor assisted by near-infrared-II light-responsive semiconducting polymer nanoparticles. ACS Appl. Mater. Interfaces, 12, 33492-33499(2020).
[19] A. Ron, X. L. Deán-Ben, S. Gottschalk, D. Razansky. Volumetric optoacoustic imaging unveils high-resolution patterns of acute and cyclic hypoxia in a murine model of breast cancer. Cancer Res., 79, 4767-4775(2019).
[20] J. Yao. Wide-field fast-scanning photoacoustic microscopy based on a water-immersible MEMS scanning mirror. J. Biomed. Opt., 17, 080505(2012).
[21] L. Wang, K. Maslov, L. V. Wang. Single-cell label-free photoacoustic flowoxigraphy in vivo. Proc. Natl. Acad. Sci. USA, 110, 5759-5764(2013).
[22] L. Wang, K. Maslov, J. Yao, B. Rao, L. V. Wang. Fast voice-coil scanning optical-resolution photoacoustic microscopy. Opt. Lett., 36, 139-141(2011).
[23] J. Kim, J. Y. Kim, S. Jeon, J. W. Baik, S. H. Cho, C. Kim. Super-resolution localization photoacoustic microscopy using intrinsic red blood cells as contrast absorbers. Light Sci. Appl., 8, 103(2019).
[24] J. Shi, T. T. W. Wong, Y. He, L. Li, R. Zhang, C. S. Yung, J. Hwang, K. Maslov, L. V. Wang. High-resolution, high-contrast mid-infrared imaging of fresh biological samples with ultraviolet-localized photoacoustic microscopy. Nat. Photonics, 13, 609-615(2019).
[25] J. Chen, Y. Zhang, L. He, Y. Liang, L. Wang. Wide-field polygon-scanning photoacoustic microscopy of oxygen saturation at 1-MHz A-line rate. Photoacoustics, 20, 100195(2020).
[26] R. Cao, J. Li, B. Ning, N. Sun, T. Wang, Z. Zuo, S. Hu. Functional and oxygen-metabolic photoacoustic microscopy of the awake mouse brain. Neuroimage, 150, 77-87(2017).
[27] D. Li, C. Liu, Y. Yang, L. Wang, Y. Shen. Micro-rocket robot with all-optic actuating and tracking in the blood. Light Sci. Appl., 9, 84(2020).
[28] L. Wang, C. Zhang, L. V. Wang. Grueneisen relaxation photoacoustic microscopy. Phys. Rev. Lett., 113, 174301(2014).
[29] S. Li, Q. Deng, Y. Zhang, X. Li, G. Wen, X. Cui, Y. Wan, Y. Huang, J. Chen, Z. Liu, L. Wang, C. S. Lee. Rational design of conjugated small molecules for superior photothermal theranostics in the NIR-II biowindow. Adv. Mater., 32, 2001146(2020).
[30] M. Li, Y. Tang, J. Yao. Photoacoustic tomography of blood oxygenation: a mini review. Photoacoustics, 10, 65-73(2018).
[31] Y. Liang, L. Jin, B.-O. Guan, L. Wang. 2 MHz multi-wavelength pulsed laser for functional photoacoustic microscopy. Opt. Lett., 42, 1452-1455(2017).
[32] C. Liu, Y. Liang, L. Wang. Single-shot photoacoustic microscopy of hemoglobin concentration, oxygen saturation, and blood flow in sub-microseconds. Photoacoustics, 17, 100156(2020).
[33] J. Yao, K. I. Maslov, Y. Zhang, Y. Xia, L. V. Wang. Label-free oxygen-metabolic photoacoustic microscopy in vivo. J. Biomed. Opt., 16, 076003(2011).
[34] B. Guo, J. Chen, N. Chen, E. Middha, S. Xu, Y. Pan, M. Wu. High-resolution 3D NIR-II photoacoustic imaging of cerebral and tumor vasculatures using conjugated polymer nanoparticles as contrast agent. Adv. Mater., 31, 1808355(2019).
[35] R. García-Álvarez, L. Chen, A. Nedilko, A. Sánchez-Iglesias, A. Rix, W. Lederle, V. Pathak, T. Lammers, G. Von Plessen, K. Kostarelos, L. M. Liz-Marzán, A. J. C. Kuehne, D. N. Chigrin. Optimizing the geometry of photoacoustically active gold nanoparticles for biomedical imaging. ACS Photon., 7, 646-652(2020).
[36] C. Li, J. Shi, X. Wang, B. Wang, X. Gong, L. Song, K. K. Y. Wong. High-energy all-fiber gain-switched thulium-doped fiber laser for volumetric photoacoustic imaging of lipids. Photon. Res., 8, 160-164(2020).
[37] S. Jeon, J. Kim, D. Lee, J. W. Baik, C. Kim. Review on practical photoacoustic microscopy. Photoacoustics, 15, 100141(2019).
[38] Y. Wang, K. Maslov, C. Kim, S. Hu, L. V. Wang. Integrated photoacoustic and fluorescence confocal microscopy. IEEE Trans. Biomed. Eng., 57, 2576-2578(2010).
[39] J. Yao, L. V. Wang. Photoacoustic microscopy. Laser Photon. Rev., 7, 758-778(2013).
[40] L. Lin, J. Yao, R. Zhang, C. C. Chen, C. H. Huang, Y. Li, L. Wang, W. Chapman, J. Zou, L. V. Wang. High-speed photoacoustic microscopy of mouse cortical microhemodynamics. J. Biophoton., 10, 792-798(2017).
[41] C. Stapf, J. P. Mohr, J. Pile-Spellman, R. R. Sciacca, A. Hartmann, H. C. Schumacher, H. Mast. Concurrent arterial aneurysms in brain arteriovenous malformations with haemorrhagic presentation. J. Neurol. Neurosurg. Psychiatry, 73, 294-298(2002).
[42] A. K. Iyer, G. Khaled, J. Fang, H. Maeda. Exploiting the enhanced permeability and retention effect for tumor targeting. Drug Discov. Today, 11, 812-818(2006).
[43] Y. Matsumura, H. Maeda. A new concept for macromolecular therapeutics in cancer chemotherapy: mechanism of tumoritropic accumulation of proteins and the antitumor agent smancs. Cancer Res., 46, 6387-6392(1986).


