• Acta Optica Sinica
  • Vol. 38, Issue 11, 1134001 (2018)
Jianbang Liu**, Xiaoqi Xi, Yu Han, Lei Li, Haibing Bu, and Bin Yan*
Author Affiliations
  • Information System Engineering College, Information Engineering University, Zhengzhou, Henan 450002, China
  • show less
    DOI: 10.3788/AOS201838.1134001 Cite this Article Set citation alerts
    Jianbang Liu, Xiaoqi Xi, Yu Han, Lei Li, Haibing Bu, Bin Yan. A New Scattering Artifact Correction Method Based on K-N Formula for Cone-Beam Computed Tomography[J]. Acta Optica Sinica, 2018, 38(11): 1134001 Copy Citation Text show less
    Diagram of effect of X-ray on single scattering point
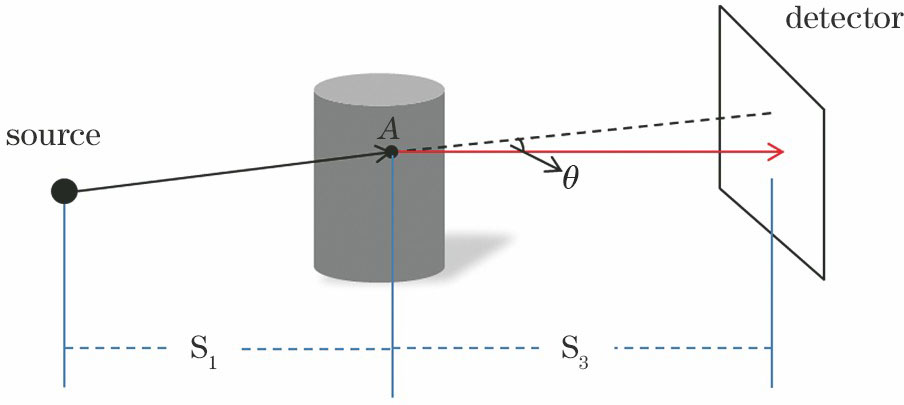
    Fig. 1. Diagram of effect of X-ray on single scattering point
    Scattering correction process flow chart
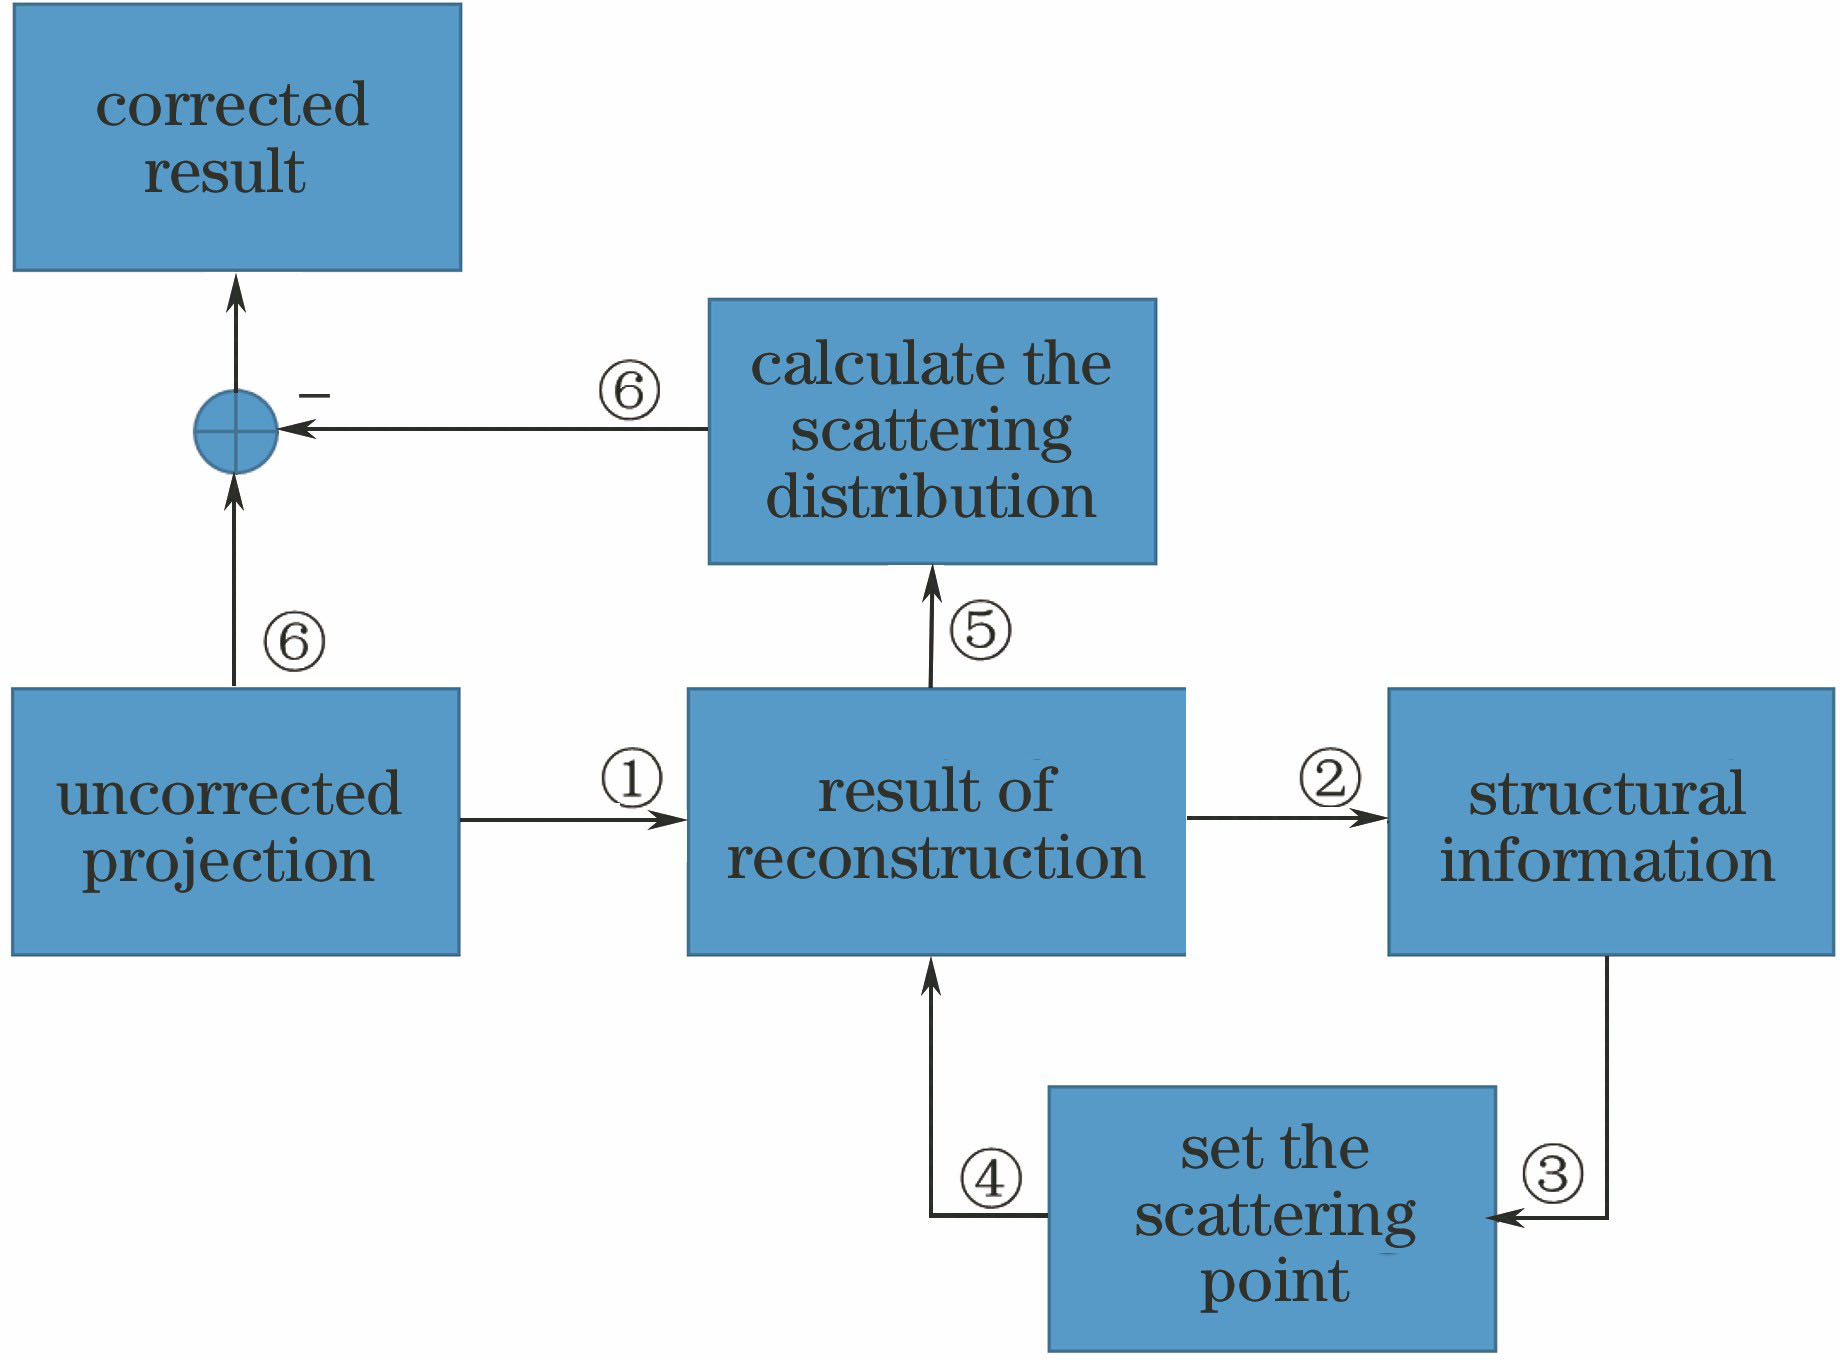
    Fig. 2. Scattering correction process flow chart
    Schematic of scattering point setting
    Fig. 3. Schematic of scattering point setting
    Schematic diagram of simulation system
    Fig. 4. Schematic diagram of simulation system
    Scattering proportion distributions of simple model. (a) Produced by point; (b) produced by line; (c) produced by plane
    Fig. 5. Scattering proportion distributions of simple model. (a) Produced by point; (b) produced by line; (c) produced by plane
    Reconstructions of aluminum cylinder. (a) Scattering distribution produced by the aluminum cylinder; (b) result without scattering correction; (c) result with scattering correction; (d) profile of CT values on the red line in Fig. 6 (b)-Fig. 6 (c)
    Fig. 6. Reconstructions of aluminum cylinder. (a) Scattering distribution produced by the aluminum cylinder; (b) result without scattering correction; (c) result with scattering correction; (d) profile of CT values on the red line in Fig. 6 (b)-Fig. 6 (c)
    Projection distributions under different T values. (a) Projection without correction; (b) projection at T=0.3125; (c) projection at T=0.6583; (d) projection at T=0.9470
    Fig. 7. Projection distributions under different T values. (a) Projection without correction; (b) projection at T=0.3125; (c) projection at T=0.6583; (d) projection at T=0.9470
    Contrast diagrams of correction effect. (a) Correction with BSA; (b) correction with proposed method; (c) CT value in center location with BSA; (d) CT value in center location with proposed method
    Fig. 8. Contrast diagrams of correction effect. (a) Correction with BSA; (b) correction with proposed method; (c) CT value in center location with BSA; (d) CT value in center location with proposed method
    Reconstructions of industrial components. (a) Result without scattering correction; (b) result with scattering correction; (c) another layer of image results without correction; (d) another layer of image results with correction; (e) and (f) local magnified images of Fig. 9(c) and Fig. 9(d), respectively; (g) profiles of CT values on the red line in Fig. 9(a) and Fig. 9(b)
    Fig. 9. Reconstructions of industrial components. (a) Result without scattering correction; (b) result with scattering correction; (c) another layer of image results without correction; (d) another layer of image results with correction; (e) and (f) local magnified images of Fig. 9(c) and Fig. 9(d), respectively; (g) profiles of CT values on the red line in Fig. 9(a) and Fig. 9(b)
    CorrectionCNRContrastσTcup/%
    Without scattering correction3.93725.34820.56021.429
    With scattering correction6.07741.90224.2125.063
    Table 1. Quantitative analysis of aluminium cylinder
    CorrectionCNRContrastσTcup /%
    Without scattering correction7.35513.306595.563018.5762
    With scattering correction9.39895.0955119.51418.6453
    Table 2. Quantitative analysis of the industrial component
    Jianbang Liu, Xiaoqi Xi, Yu Han, Lei Li, Haibing Bu, Bin Yan. A New Scattering Artifact Correction Method Based on K-N Formula for Cone-Beam Computed Tomography[J]. Acta Optica Sinica, 2018, 38(11): 1134001
    Download Citation