
Jörg Körner, Venkatesan Jambunathan, Fangxin Yue, Jürgen Reiter, Ondřej Slezák, Petr Navrátil, Samuel Paul David, Antonio Lucianetti, Joachim Hein, Tomáš Mocek, Malte C. Kaluza. Diode-pumped, electro-optically Q-switched, cryogenic Tm:YAG laser operating at 1.88 μm[J]. High Power Laser Science and Engineering, 2021, 9(2): 02000e11
- High Power Laser Science and Engineering
- Vol. 9, Issue 2, 02000e11 (2021)
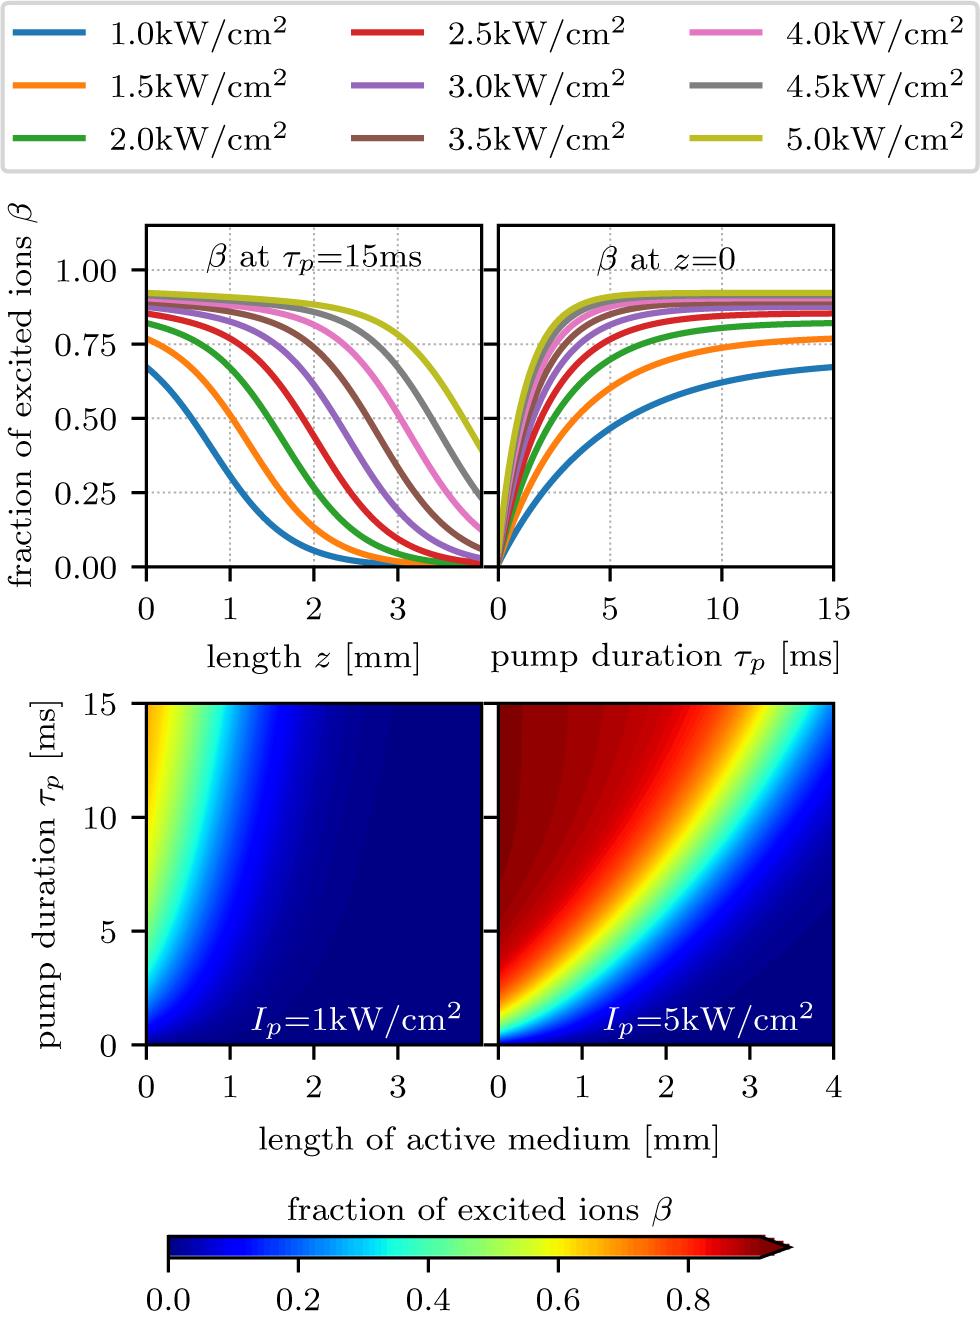
Fig. 1. Results from the numerical simulation of the pump process in an 8% (atomic fraction) doped Tm:YAG crystal with a pump duration of 15 ms assuming a fluorescence lifetime of 15 ms. Upper left graph: relative inversion density  as a function of the penetration depth
  in the laser crystal for different pump intensities at the end of the pump pulse. Upper right graph: relative inversion density
  on the crystal’s entrance surface as a function of the pump duration
  for various pump intensities. Lower graphs: relative inversion density
  as a function of the penetration depth
  (horizontal) and pump duration
  (vertical) for a pump intensity of 1 kW/cm2 (left) and 5 kW/cm2 (right).
as a function of the penetration depth in the laser crystal for different pump intensities at the end of the pump pulse. Upper right graph: relative inversion density on the crystal’s entrance surface as a function of the pump duration for various pump intensities. Lower graphs: relative inversion density as a function of the penetration depth (horizontal) and pump duration (vertical) for a pump intensity of 1 kW/cm2 (left) and 5 kW/cm2 (right). 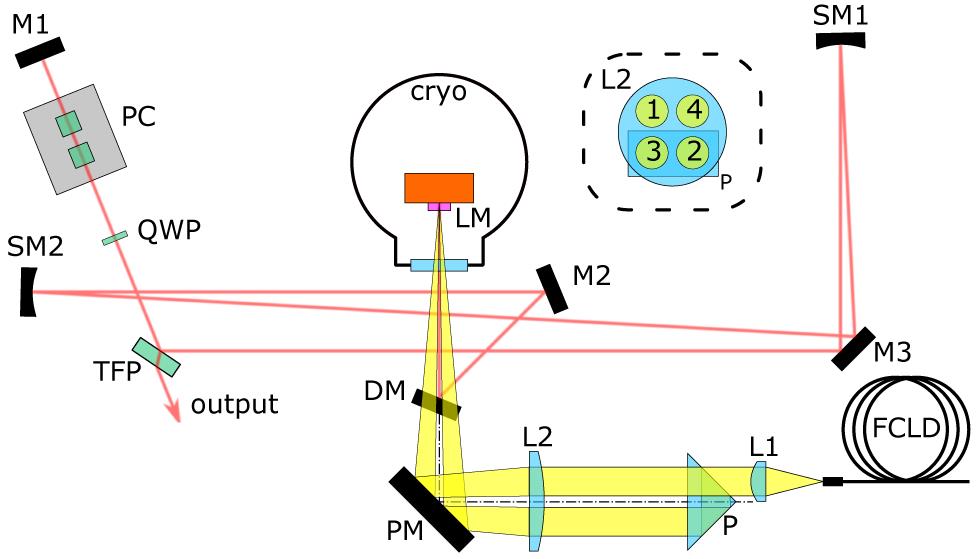
Fig. 2. Schematic of the laser setup. The dashed box inset shows the hit points of the pump beam on L2 and P. Cryo, high-vacuum cryostat; DM, dichroic mirror; FCLD, fiber-coupled laser diode; L1 and L2, lenses; LM, active mirror laser medium; M1, M2, M3, turning mirrors; P, retro-reflector prism; PC, Pockels cell; PM, pump turning mirror; QWP, quarter wave plate; SM1 and SM2, spherical mirrors; TFP, thin-film polarizer.
Fig. 3. Output energy  , optical-to-optical efficiency
  and full width at half maximum output pulse duration
  as functions of the pump pulse duration in
 Q -switch operation. The pump diode was operated at 28 W peak power and 1 Hz repetition rate. The secondary x -axis on top indicates the total pump energy  applied.
, optical-to-optical efficiency and full width at half maximum output pulse duration as functions of the pump pulse duration in applied. Fig. 4. Temporal pulse shapes of the intracavity signal and the output pulse at maximum energy.
Fig. 5. Output laser profile in Q -switch operation. The black curves at the sides are the averaged cross-sections.

Set citation alerts for the article
Please enter your email address
© Copyright 2018-2021 | Chinese Laser Press. All Rights Reserved 沪ICP备15018463号-20