• Laser & Optoelectronics Progress
  • Vol. 55, Issue 5, 052901 (2018)
Yan Yuan, Ding Jin, and Lijuan Su*;
Author Affiliations
  • Key Laboratory of Precision Opto-Mechatronics Technology of Ministry of Education, Beihang University, Beijing 100191, China
  • show less
    DOI: 10.3788/LOP55.052901 Cite this Article Set citation alerts
    Yan Yuan, Ding Jin, Lijuan Su. Optimization Modeling and Verification of Bidirectional Reflectance Distribution Function for Rough Surfaces[J]. Laser & Optoelectronics Progress, 2018, 55(5): 052901 Copy Citation Text show less
    REFLET goniophotometer. (a) Integral structure; (b) optical table and darkroom
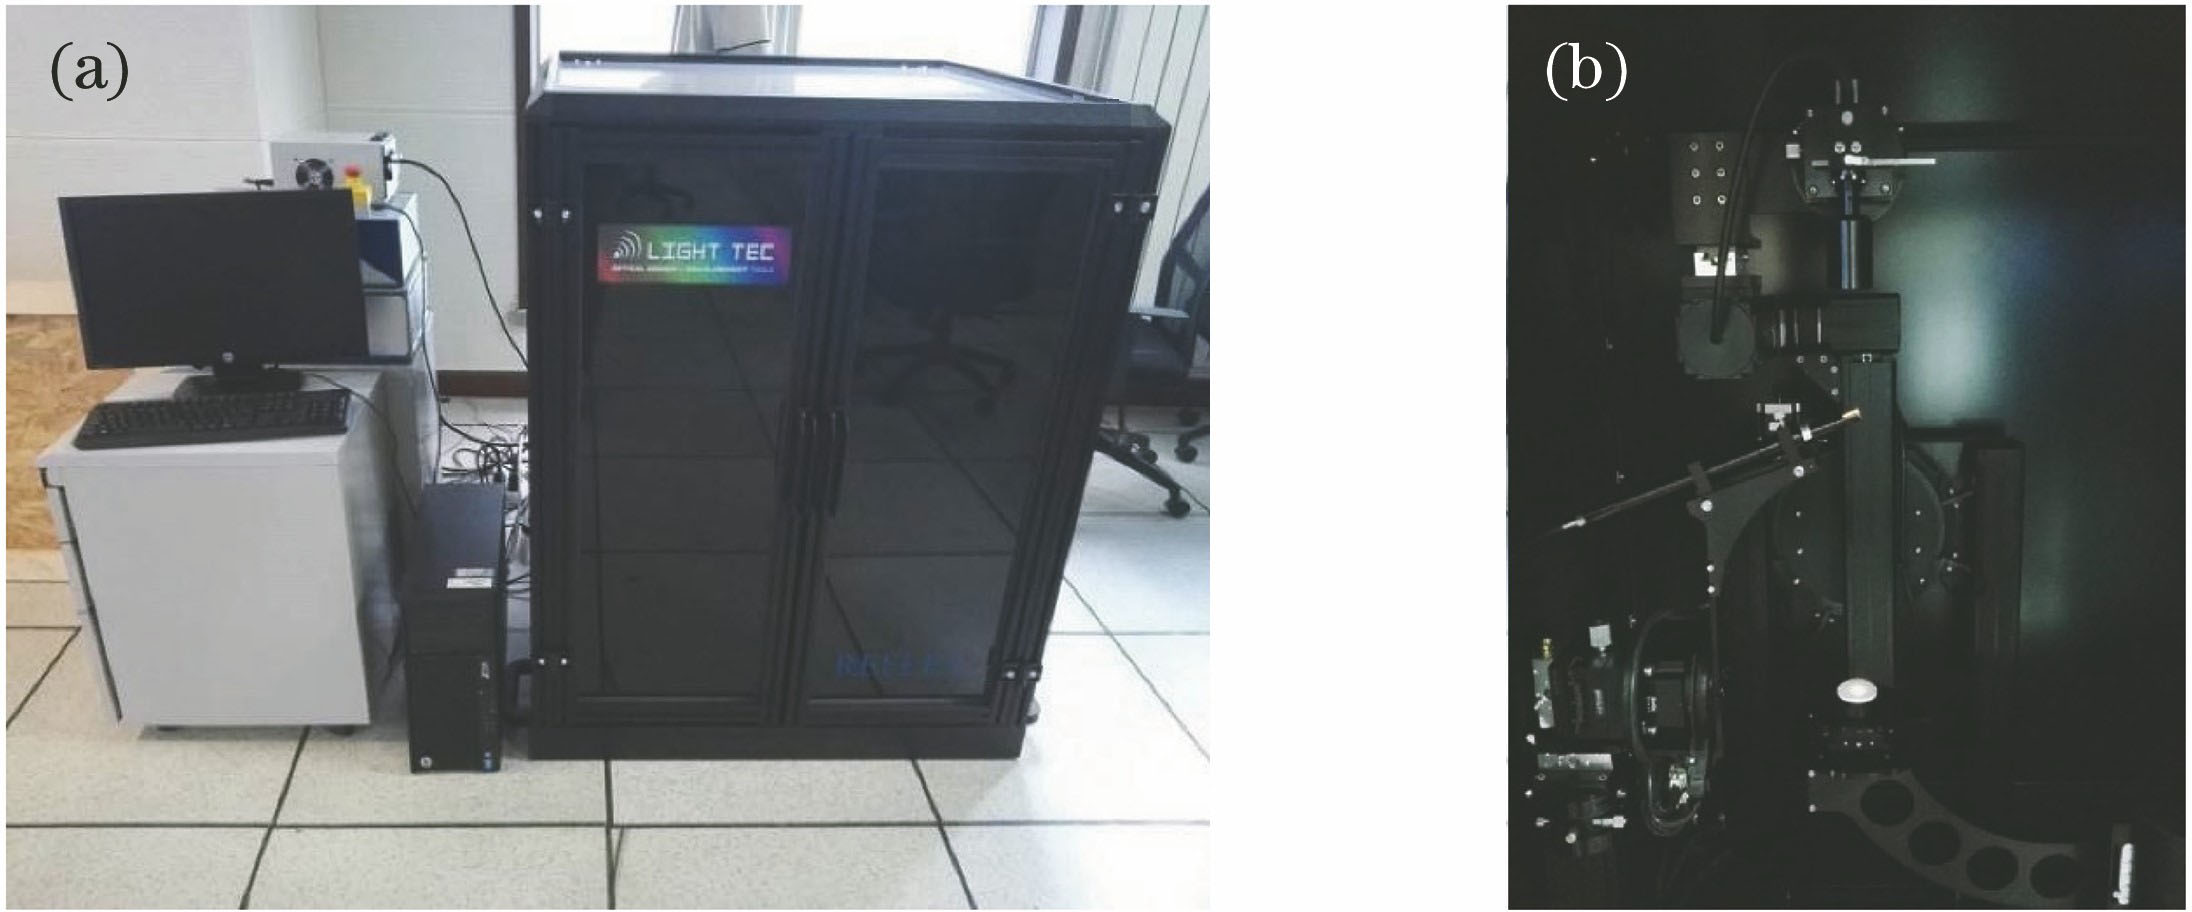
    Fig. 1. REFLET goniophotometer. (a) Integral structure; (b) optical table and darkroom
    Test samples. (a) 2024 aluminum alloy, R=0.8 μm; (b) 2024 aluminum alloy, R=6.3 μm; (c) 2024 aluminum alloy, R=50 μm; (d) cement plate; (e) aluminum plate blasted with brown corundum
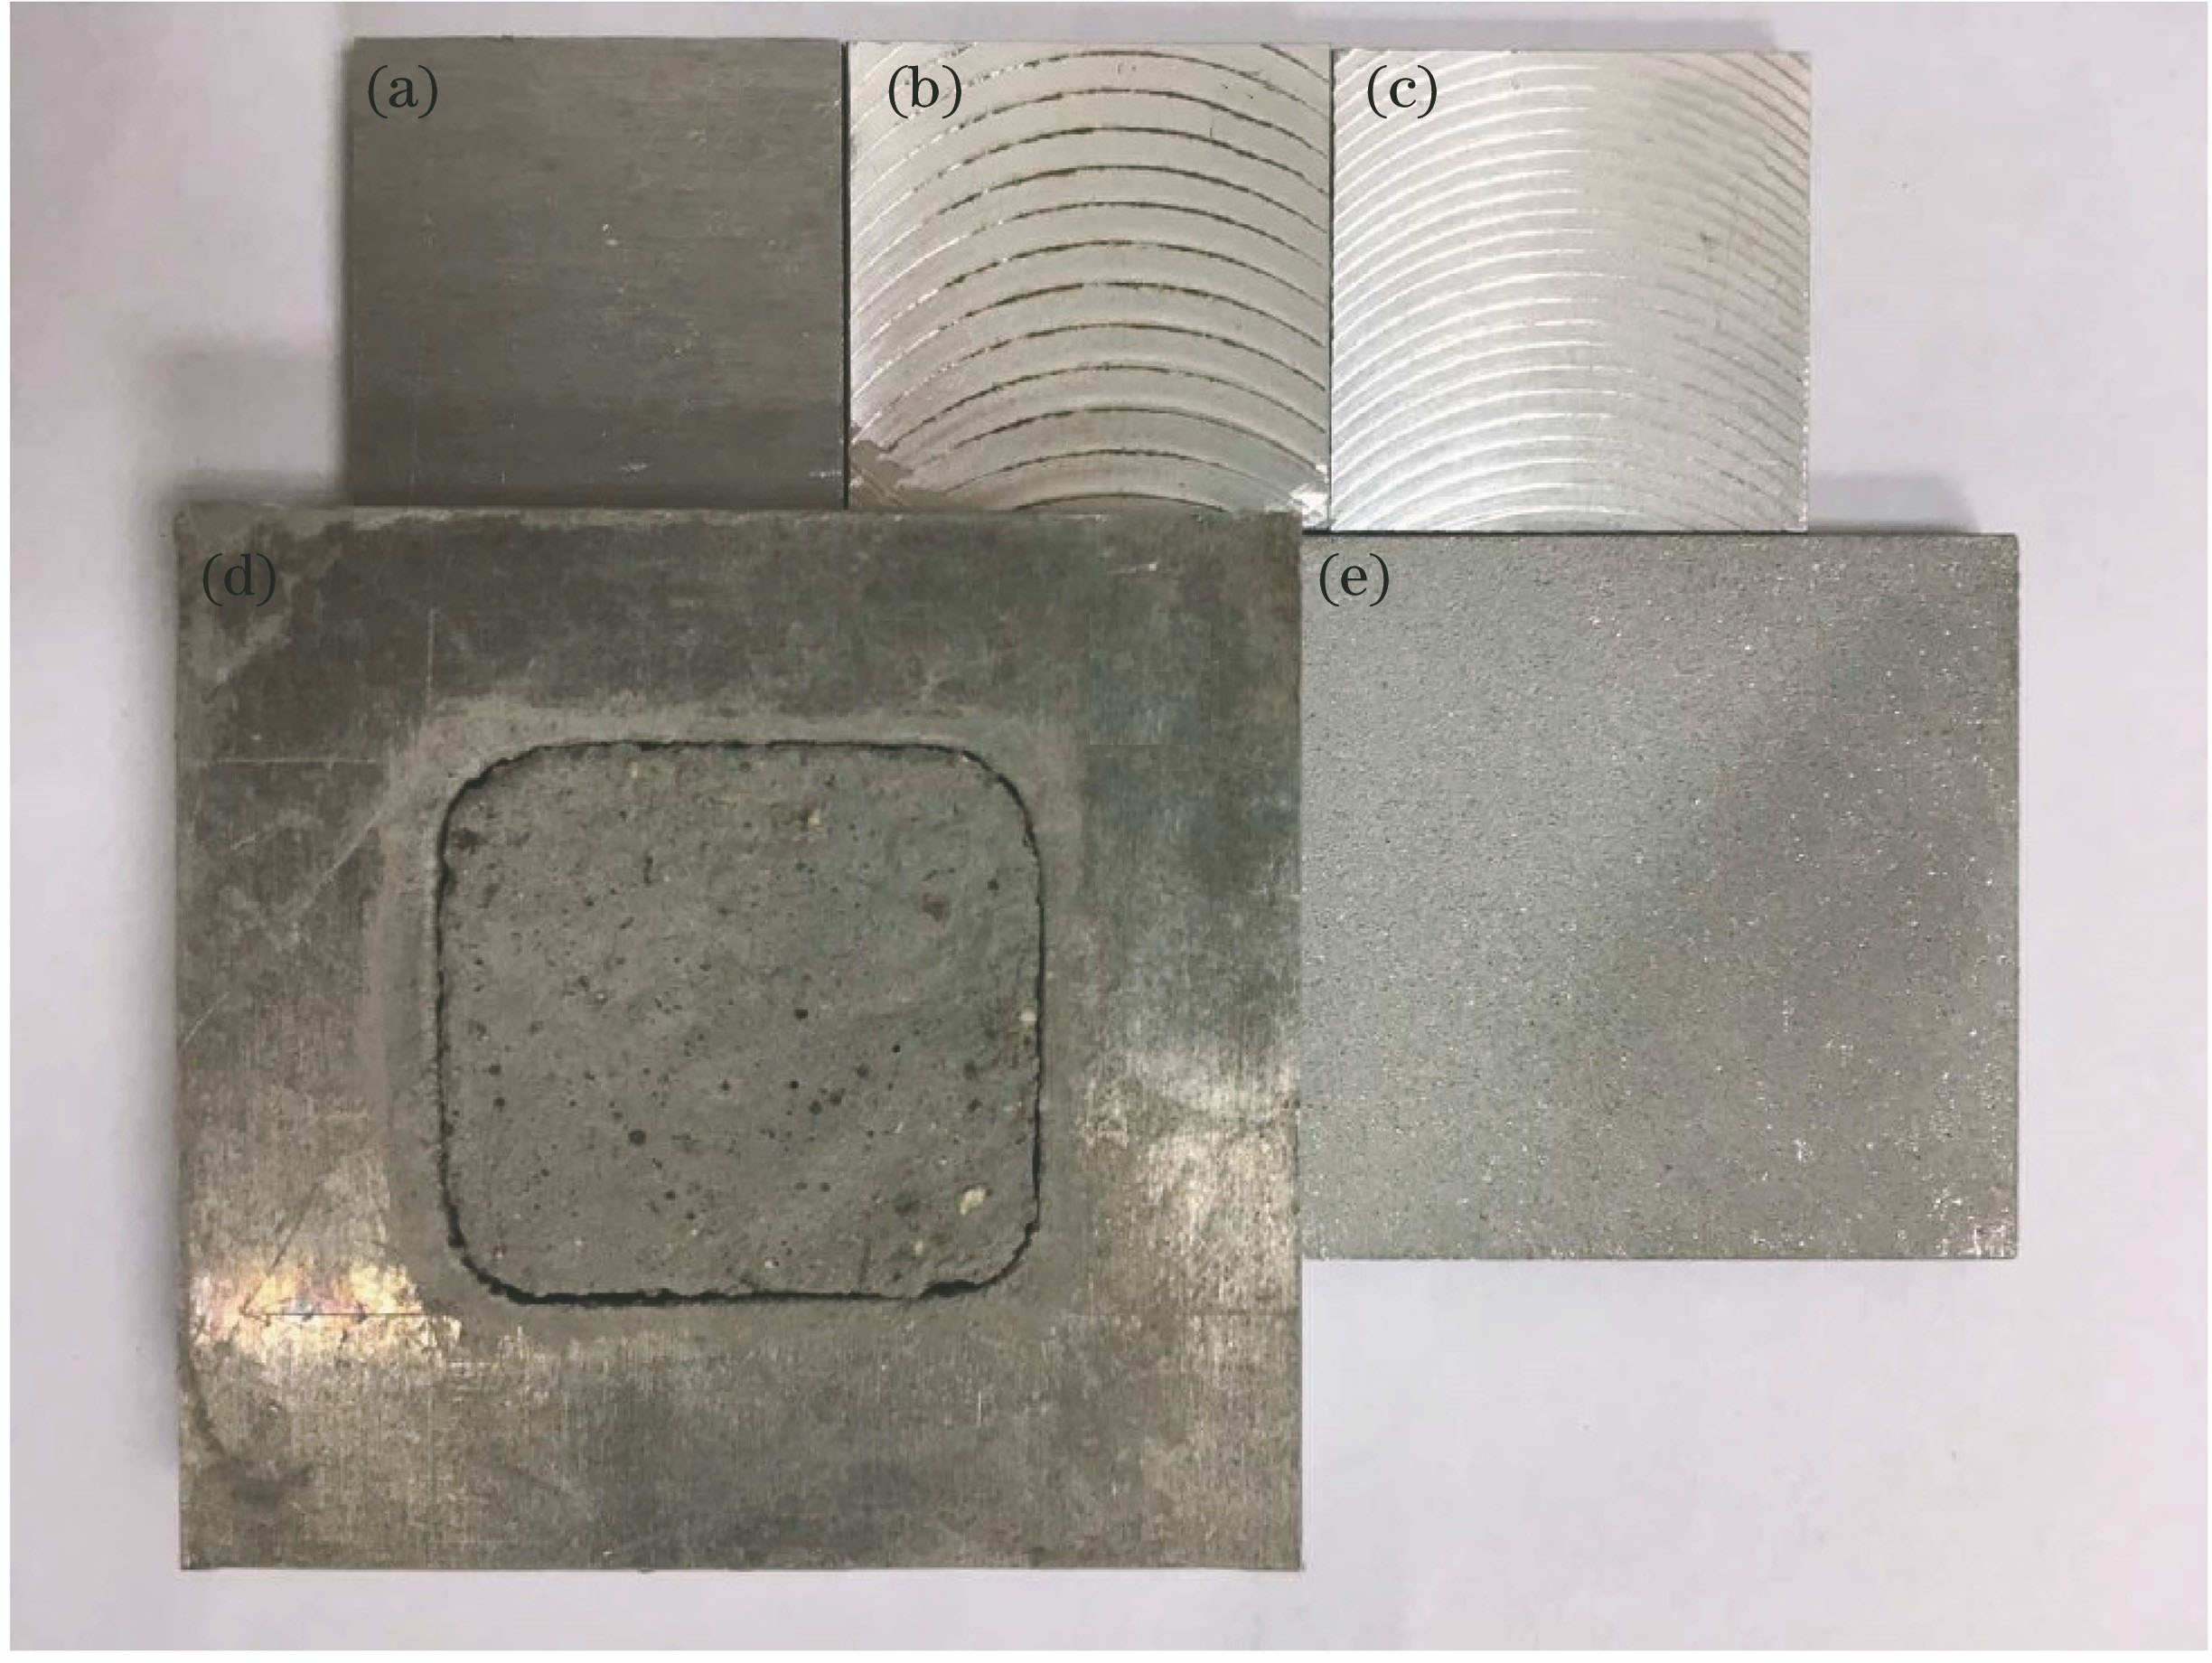
    Fig. 2. Test samples. (a) 2024 aluminum alloy, R=0.8 μm; (b) 2024 aluminum alloy, R=6.3 μm; (c) 2024 aluminum alloy, R=50 μm; (d) cement plate; (e) aluminum plate blasted with brown corundum
    Measurement results of the BRDF of samples. (a) 2024 aluminum alloy, R=0.8 μm; (b) 2024 aluminum alloy, R=6.3 μm; (c) 2024 aluminum alloy, R=50 μm; (d) cement plate, PTFE, aluminum plate blasted with brown corundum (θi=0°)
    Fig. 3. Measurement results of the BRDF of samples. (a) 2024 aluminum alloy, R=0.8 μm; (b) 2024 aluminum alloy, R=6.3 μm; (c) 2024 aluminum alloy, R=50 μm; (d) cement plate, PTFE, aluminum plate blasted with brown corundum (θi=0°)
    BRDF model fitting results and experimental measurement results of 2024 aluminum alloy sample with R=6.3 μm
    Fig. 4. BRDF model fitting results and experimental measurement results of 2024 aluminum alloy sample with R=6.3 μm
    BRDF model fitting results and experimental measurement results of material samples with rough surface
    Fig. 5. BRDF model fitting results and experimental measurement results of material samples with rough surface
    2024 aluminum alloys amplekbkdkrabE(x) /%
    R=0.8 μm20.0660.0751.3760.479-64.4396.08
    R=6.3 μm17.6950.0032.7040.537-46.1222.38
    R=50 μm7.5260.1551.2290.689-58.6483.19
    Table 1. Modeling results of 2024 aluminum alloy sample with different roughnesses
    SampleabE(x) /%
    PTFE0.9821.0041.43
    CEMENT0.2820.9851.16
    BROWN0.4191.1901.30
    Table 2. Modeling results of material samples with rough surface
    SampleAlgorithmkbkdkrabE(x) /%Time /s
    2024aluminum alloy(R=6.3 μm)GA18.9510.1431.5320.630-63.2654.52933
    PSO15.9580.6115.8940.557-50.3544.61679
    SAPSO17.6950.0032.7040.537-46.1222.38696
    BROWNGA---0.4281.1031.45598
    PSO---0.4351.2111.51404
    SAPSO---0.4191.1901.30427
    Table 3. Modeling results of different optimization algorithms
    Yan Yuan, Ding Jin, Lijuan Su. Optimization Modeling and Verification of Bidirectional Reflectance Distribution Function for Rough Surfaces[J]. Laser & Optoelectronics Progress, 2018, 55(5): 052901
    Download Citation