• Photonics Insights
  • Vol. 2, Issue 2, R05 (2023)
Qiannan Jia1、2, Wei Lyu1、2, Wei Yan1、2、*, Weiwei Tang1、2、3、*, Jinsheng Lu4、*, and Min Qiu1、2、*
Author Affiliations
  • 1Key Laboratory of 3D Micro/Nano Fabrication and Characterization of Zhejiang Province, School of Engineering, Westlake University, Hangzhou, China
  • 2Institute of Advanced Technology, Westlake Institute for Advanced Study, Hangzhou, China
  • 3College of Physics and Optoelectronic Engineering, Hangzhou Institute for Advanced Study, University of Chinese Academy of Sciences, Hangzhou, China
  • 4Harvard John A. Paulson School of Engineering and Applied Sciences, Harvard University, Cambridge, United States
  • show less
    DOI: 10.3788/PI.2023.R05 Cite this Article Set citation alerts
    Qiannan Jia, Wei Lyu, Wei Yan, Weiwei Tang, Jinsheng Lu, Min Qiu. Optical manipulation: from fluid to solid domains[J]. Photonics Insights, 2023, 2(2): R05 Copy Citation Text show less
    Overview of optical manipulations in fluid domains and solid domains. Optical manipulations generally include optical trapping, pulling and pushing, lateral manipulation, spinning and orbital rotating, and multi-degree-of-freedom manipulation. Optical manipulations in fluid domains are based on light directly induced forces (i.e., optical gradient forces and optical scattering forces) and indirectly induced forces (e.g., photophoretic force and thermal-electric mediated forces) whose amplitudes are typically of the order from pN to nN. In contrast, optical manipulations on solid surfaces need driving forces larger than μN to overcome the tremendous adhesion/friction forces in micro/nano scales. Examples include opto-thermal-elastic forces, pulsed light-induced forces, light-induced forces generated from photoactive polymers, and photothermal deformation-based actuations.
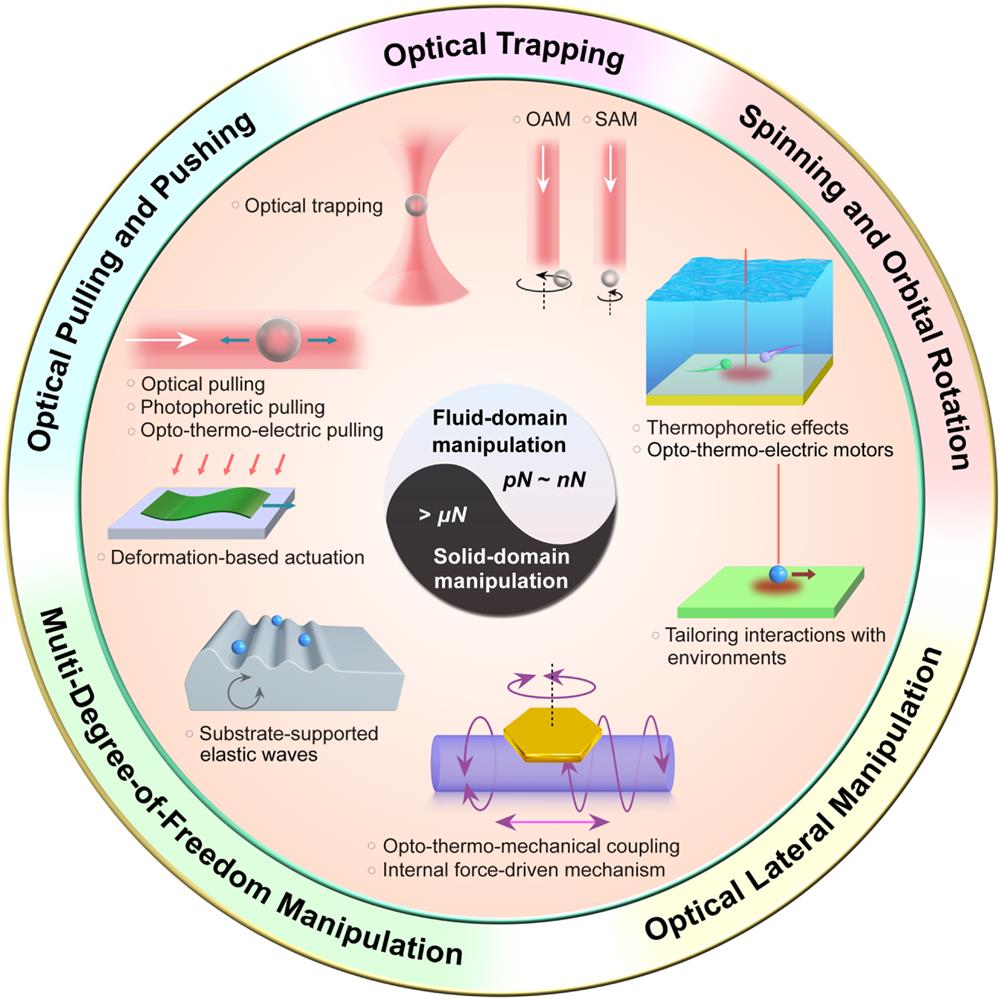
    Fig. 1. Overview of optical manipulations in fluid domains and solid domains. Optical manipulations generally include optical trapping, pulling and pushing, lateral manipulation, spinning and orbital rotating, and multi-degree-of-freedom manipulation. Optical manipulations in fluid domains are based on light directly induced forces (i.e., optical gradient forces and optical scattering forces) and indirectly induced forces (e.g., photophoretic force and thermal-electric mediated forces) whose amplitudes are typically of the order from pN to nN. In contrast, optical manipulations on solid surfaces need driving forces larger than μN to overcome the tremendous adhesion/friction forces in micro/nano scales. Examples include opto-thermal-elastic forces, pulsed light-induced forces, light-induced forces generated from photoactive polymers, and photothermal deformation-based actuations.
    Illustration of the basic principles of optical force in optical tweezers using ray optics. (a) A trapping beam is focused with the help of a high-NA objective into the sample plane, and a particle can then be trapped in the focal point of the beam due to the large intensity gradients created. The trapping laser is reflected and refracted through the particle and imparts the momentum to the particle. (b) The scattering force produced by laser reflection pushes the particle along the laser propagation direction. (c) The gradient force caused by the light intensity gradient will pull the particle toward the maximum intensity of the laser. (d) Similar arguments along the transverse direction. (e) For Rayleigh particles, the electric field of the light produces an induced dipole in the particles, which are subject to the optical gradient force pointing toward regions of high field gradients. The validity of the ray optics requires that the particle size is much larger than the wavelength, which is to roughly say at least one order of magnitude larger.
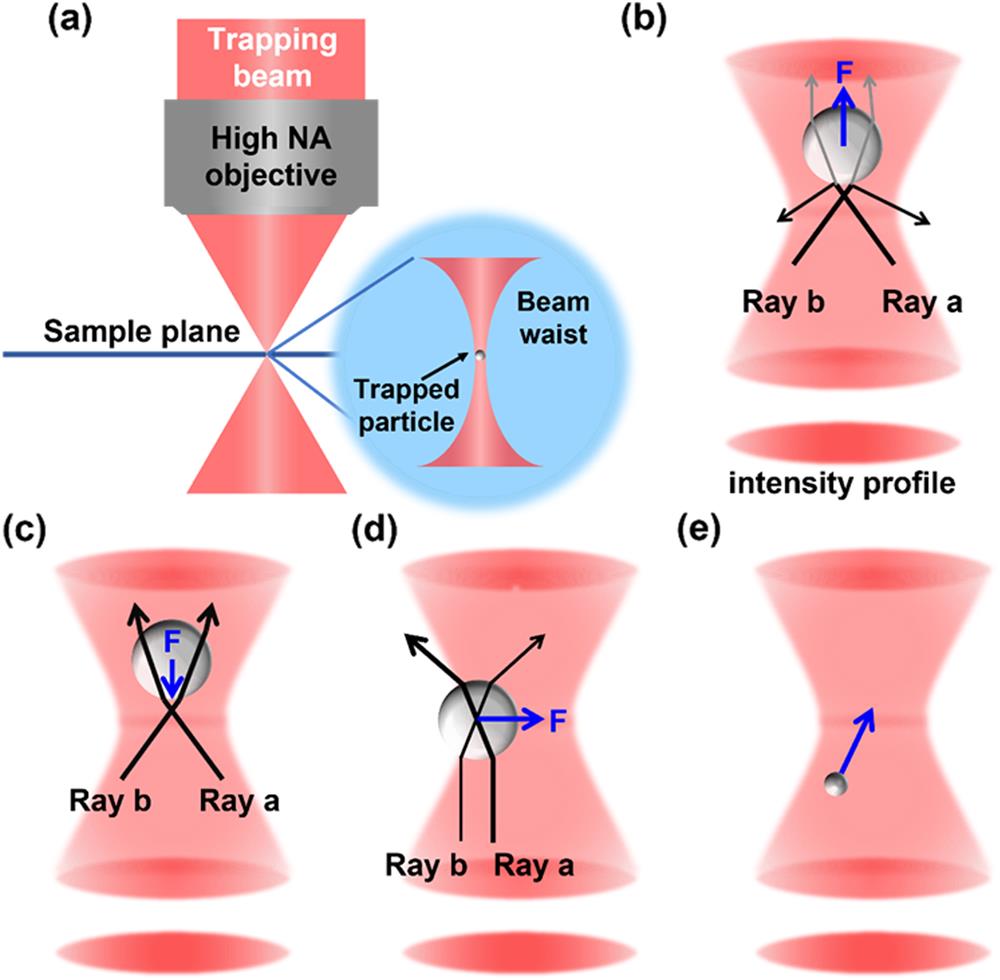
    Fig. 2. Illustration of the basic principles of optical force in optical tweezers using ray optics. (a) A trapping beam is focused with the help of a high-NA objective into the sample plane, and a particle can then be trapped in the focal point of the beam due to the large intensity gradients created. The trapping laser is reflected and refracted through the particle and imparts the momentum to the particle. (b) The scattering force produced by laser reflection pushes the particle along the laser propagation direction. (c) The gradient force caused by the light intensity gradient will pull the particle toward the maximum intensity of the laser. (d) Similar arguments along the transverse direction. (e) For Rayleigh particles, the electric field of the light produces an induced dipole in the particles, which are subject to the optical gradient force pointing toward regions of high field gradients. The validity of the ray optics requires that the particle size is much larger than the wavelength, which is to roughly say at least one order of magnitude larger.
    Experimental schematic of the conventional optical tweezers. A simple telescope is used to expand the laser beam to fill the back aperture of the objective. The expanded laser beam, reflected by a dichroic mirror, is coupled into the high-NA objective (lower objective in the sketch) and focused into the chamber. The QPD is placed in a conjugate plane of the condenser objective, collecting the interference signal between incident light and forward-scattered light from the sample. LED light is used to illuminate the sample and imaged with a CCD camera.
    Fig. 3. Experimental schematic of the conventional optical tweezers. A simple telescope is used to expand the laser beam to fill the back aperture of the objective. The expanded laser beam, reflected by a dichroic mirror, is coupled into the high-NA objective (lower objective in the sketch) and focused into the chamber. The QPD is placed in a conjugate plane of the condenser objective, collecting the interference signal between incident light and forward-scattered light from the sample. LED light is used to illuminate the sample and imaged with a CCD camera.
    Photophoretic force, which is divided into ΔT-force and Δα-force. Schematics of ΔT-force for (a) strongly absorbing and (b) weakly absorbing particles. (c) Schematic of Δα-force exerted on a particle with nonuniform thermal accommodation (α1>α2) coefficient. White, black, and blue arrows in (a)–(c) indicate the propagation of incident light, the vectoral representation of molecular velocity before and after nonelastic collisions, and the direction of the resultant photophoretic force, respectively. Adapted from Ref. [79].
    Fig. 4. Photophoretic force, which is divided into ΔT-force and Δα-force. Schematics of ΔT-force for (a) strongly absorbing and (b) weakly absorbing particles. (c) Schematic of Δα-force exerted on a particle with nonuniform thermal accommodation (α1>α2) coefficient. White, black, and blue arrows in (a)–(c) indicate the propagation of incident light, the vectoral representation of molecular velocity before and after nonelastic collisions, and the direction of the resultant photophoretic force, respectively. Adapted from Ref. [79].
    Sketch of a micro-object on a substrate driven by elastic waves induced by pulsed light. A point friction force is exerted on the micro-object when the latter moves on the substrate. Adapted from Ref. [91].
    Fig. 5. Sketch of a micro-object on a substrate driven by elastic waves induced by pulsed light. A point friction force is exerted on the micro-object when the latter moves on the substrate. Adapted from Ref. [91].
    Numerical exemplification of motion dynamics of a micro-object driven by excited elastic waves induced by pulsed light. (a) Sketch of the studied problem. A gold microplate with length and height of 10 µm and 50 nm, respectively, in the x–y plane and extension of 10 µm in the z direction sits on a SiO2 substrate. A light pulse with temporal width 3 ns is injected into the plate and results in total optical absorption energy Wabs= 0.2 nJ/μm. A friction point is placed at a 1 µm distance to the left edge of the plate, which provides a sliding resistance of Ffs=0.25 μN/μm. (b) Temporal evolutions of thermal energy (shaded area), and x-component elastic displacements of the friction point (dark solid line) and plate centroid (dashed line). For better comparisons, the x-component elastic displacement of the friction point without friction force is additionally plotted (gray solid line), which approaches zero as t→∞. (c) Profiles of x-component elastic displacements at different times t=20,200,2000,8000 ns. Adapted from Ref. [91].
    Fig. 6. Numerical exemplification of motion dynamics of a micro-object driven by excited elastic waves induced by pulsed light. (a) Sketch of the studied problem. A gold microplate with length and height of 10 µm and 50 nm, respectively, in the xy plane and extension of 10 µm in the z direction sits on a SiO2 substrate. A light pulse with temporal width 3 ns is injected into the plate and results in total optical absorption energy Wabs=0.2nJ/μm. A friction point is placed at a 1 µm distance to the left edge of the plate, which provides a sliding resistance of Ffs=0.25μN/μm. (b) Temporal evolutions of thermal energy (shaded area), and x-component elastic displacements of the friction point (dark solid line) and plate centroid (dashed line). For better comparisons, the x-component elastic displacement of the friction point without friction force is additionally plotted (gray solid line), which approaches zero as t. (c) Profiles of x-component elastic displacements at different times t=20,200,2000,8000ns. Adapted from Ref. [91].
    Conventional optical tweezers. (a) Schematic showing the origin of optical gradient and scattering forces in the Mie regime. Note that when the laser is tightly focused (right panel), the particle is subject to an axially backward radiation pressure. (b) Illustration of the potential well of the optical tweezer and its stability criterion. FWHM denotes the full width at half-maximum of the potential well. (c) Experimental setup of the optical tweezer with 3D feedback cooling. (d) Diagram of the feedback mechanism along one direction in (c). The derivative circuit (d/dt) is to deduce the particle velocity from the detected position signals. (e) Parallel manipulation of gold nanoparticles via HOT. Insets are dark field (top) and scanning microscope (bottom) images of the fabricated periodic patterns. (f) Consecutive images exhibiting dynamic manipulation of semiconductor nanowires by a holographic optical trap system. Post-processing such as cutting and welding of nanowires is included. (a) Adapted from Ref. [10]. (b) Adapted from Ref. [93]. (c), (d) Adapted from Ref. [100]. (e) Adapted from Ref. [94]. (f) Adapted from Ref. [103].
    Fig. 7. Conventional optical tweezers. (a) Schematic showing the origin of optical gradient and scattering forces in the Mie regime. Note that when the laser is tightly focused (right panel), the particle is subject to an axially backward radiation pressure. (b) Illustration of the potential well of the optical tweezer and its stability criterion. FWHM denotes the full width at half-maximum of the potential well. (c) Experimental setup of the optical tweezer with 3D feedback cooling. (d) Diagram of the feedback mechanism along one direction in (c). The derivative circuit (d/dt) is to deduce the particle velocity from the detected position signals. (e) Parallel manipulation of gold nanoparticles via HOT. Insets are dark field (top) and scanning microscope (bottom) images of the fabricated periodic patterns. (f) Consecutive images exhibiting dynamic manipulation of semiconductor nanowires by a holographic optical trap system. Post-processing such as cutting and welding of nanowires is included. (a) Adapted from Ref. [10]. (b) Adapted from Ref. [93]. (c), (d) Adapted from Ref. [100]. (e) Adapted from Ref. [94]. (f) Adapted from Ref. [103].
    Plasmonic tweezers. (a) Schematic of particles trapped in potential wells with radius of 1R (left) and 0.8R (right). Lower panels are calculated distribution probability based on the force status of corresponding particles. (b) Focused SPP trapping of Mie metallic particles via generated plasmonic virtual probe. The glass substrate satisfies the Kretschmann coupling condition. (c) Patterned SPPs for parallel trapping of colloids. (d) Detected particle displacements in an optical tweezer on a glass substrate (left) and upon a plasmonic nanogap (right). (a) Adapted from Ref. [14]. (b) Adapted from Ref. [112]. (c) Adapted from Ref. [116]. (d) Adapted from Ref. [120].
    Fig. 8. Plasmonic tweezers. (a) Schematic of particles trapped in potential wells with radius of 1R (left) and 0.8R (right). Lower panels are calculated distribution probability based on the force status of corresponding particles. (b) Focused SPP trapping of Mie metallic particles via generated plasmonic virtual probe. The glass substrate satisfies the Kretschmann coupling condition. (c) Patterned SPPs for parallel trapping of colloids. (d) Detected particle displacements in an optical tweezer on a glass substrate (left) and upon a plasmonic nanogap (right). (a) Adapted from Ref. [14]. (b) Adapted from Ref. [112]. (c) Adapted from Ref. [116]. (d) Adapted from Ref. [120].
    Resonance dielectric tweezers. (a) Schematic of a 1D silicon photonic crystal resonator used for optical trapping. (b) Simulated mode profile of the photonic crystal resonator in (a) at resonance. The electric field magnification and localization are characteristic of the cavity mode of a dielectric resonator. Black arrows denote the magnitude and direction of the local optical force. (c) Schematic of the multiplexed optical trapping based on an all-dielectric metasurface supporting quasi-bound states in the continuum in each of its unit cells. Nanoparticles would be trapped at the gaps of the elliptical nanoantenna pairs (the unit cell), where the local electric fields are strongly enhanced due to the lack of out-coupling channels. (d) SEM image of a nanocuboid array fabricated with amorphous silicon supporting anapole modes. (e) Calculated profile of the optical force upon 100 nm bead in the plane z=50 nm above a unit cell of the device surface. The local light intensity is 39 μW/μm2. (a), (b) Adapted from Ref. [16]. (c) Adapted from Ref. [128]. (d), (e) Adapted from Ref. [134].
    Fig. 9. Resonance dielectric tweezers. (a) Schematic of a 1D silicon photonic crystal resonator used for optical trapping. (b) Simulated mode profile of the photonic crystal resonator in (a) at resonance. The electric field magnification and localization are characteristic of the cavity mode of a dielectric resonator. Black arrows denote the magnitude and direction of the local optical force. (c) Schematic of the multiplexed optical trapping based on an all-dielectric metasurface supporting quasi-bound states in the continuum in each of its unit cells. Nanoparticles would be trapped at the gaps of the elliptical nanoantenna pairs (the unit cell), where the local electric fields are strongly enhanced due to the lack of out-coupling channels. (d) SEM image of a nanocuboid array fabricated with amorphous silicon supporting anapole modes. (e) Calculated profile of the optical force upon 100 nm bead in the plane z=50nm above a unit cell of the device surface. The local light intensity is 39μW/μm2. (a), (b) Adapted from Ref. [16]. (c) Adapted from Ref. [128]. (d), (e) Adapted from Ref. [134].
    Integrated optical tweezers. (a) Schematic of a micro-ring system with a trapped dielectric particle moving around on top of it. Incident light is coupled from the left port into the bus waveguide. (b) Recorded time-dependent x and y displacements of a trapped particle (∼500 nm) on a 10 µm radius micro-ring, corresponding to a rotation frequency of 2.5 Hz. (c) Cross-section sketch of the on-chip optical tweezer based on freeform optics. (d) Simulated light intensity distribution of the transverse-electric (TE) mode. Inset illustrates the formation of a standing wave along the x axis. (e) Simulated electric field distribution at a fiber end face terminated with polystyrene micro-spheres. (f) Dark field optical image showing parallel trapping of 190 nm fluorescent nanoparticles on the shadowy side of the microlens array. (g) Holographic parallel trapping of nine particles. The trapping sites are projected through a homemade high-NA multimode fiber. (h) Optical images and schematics of two particles being delivered into a ∼125 μm cavity by the fiber-integrated HOT. Scale bars are 5 µm in (g) and 10 µm in (h). (a), (b) Adapted from Ref. [140]. (c), (d) Adapted from Ref. [141]. (e), (f) Adapted from Ref. [148]. (g), (h) Adapted from Ref. [151].
    Fig. 10. Integrated optical tweezers. (a) Schematic of a micro-ring system with a trapped dielectric particle moving around on top of it. Incident light is coupled from the left port into the bus waveguide. (b) Recorded time-dependent x and y displacements of a trapped particle (500nm) on a 10 µm radius micro-ring, corresponding to a rotation frequency of 2.5 Hz. (c) Cross-section sketch of the on-chip optical tweezer based on freeform optics. (d) Simulated light intensity distribution of the transverse-electric (TE) mode. Inset illustrates the formation of a standing wave along the x axis. (e) Simulated electric field distribution at a fiber end face terminated with polystyrene micro-spheres. (f) Dark field optical image showing parallel trapping of 190 nm fluorescent nanoparticles on the shadowy side of the microlens array. (g) Holographic parallel trapping of nine particles. The trapping sites are projected through a homemade high-NA multimode fiber. (h) Optical images and schematics of two particles being delivered into a 125μm cavity by the fiber-integrated HOT. Scale bars are 5 µm in (g) and 10 µm in (h). (a), (b) Adapted from Ref. [140]. (c), (d) Adapted from Ref. [141]. (e), (f) Adapted from Ref. [148]. (g), (h) Adapted from Ref. [151].
    Thermophoretic tweezers. (a) Experimental setup of the optical vortex pipeline for long-range particle delivery. Inset shows a photograph of the transverse trapping of an absorbing particle that is slightly displaced from the vortex center due to gravitational drag. (b) Schematic of remote particle manipulation. (c) Calculated and measured light intensity profile along the axial direction within a paraxial aberrated focus. z=0 denotes the position of the Gaussian focus without aberration. (d) Opposite side views of the 3D light intensity profile of a bottle beam. Absorptive aerosol particles can be trapped within the annular bright walls that “cup” the trapping site. (e) Sketch and measured trajectory points of a 200 nm PS particle showing successful thermophoretic trapping within the region surrounded by laser-heated hexagonal gold patches. The laser illuminates one patch at a time with a rotation frequency of 18.9 Hz and 5 mW light power. (f) Bar graph of the radial position distribution of the trapped particle in (e), which can be fitted with a Rayleigh distribution function. (g) Schematic of the opto-refrigerative tweezer exploiting laser cooling. (h) Measured temperature profile under laser cooling with an illumination intensity of 25.8 mW/μm2. White arrows point along the direction of temperature increase, while the pink arrow indicates the thermodiffusive velocity of the particle. (i) Comparison of the time-resolved fluorescence of dye particles trapped by an opto-refregerative tweezer (ORT) and a conventional optical tweezer. (a), (b) Adapted from Ref. [92]. (c), (d) Adapted from Ref. [152]. (e), (f) Adapted from Ref. [156]. (g)–(i) Adapted from Ref. [159].
    Fig. 11. Thermophoretic tweezers. (a) Experimental setup of the optical vortex pipeline for long-range particle delivery. Inset shows a photograph of the transverse trapping of an absorbing particle that is slightly displaced from the vortex center due to gravitational drag. (b) Schematic of remote particle manipulation. (c) Calculated and measured light intensity profile along the axial direction within a paraxial aberrated focus. z=0 denotes the position of the Gaussian focus without aberration. (d) Opposite side views of the 3D light intensity profile of a bottle beam. Absorptive aerosol particles can be trapped within the annular bright walls that “cup” the trapping site. (e) Sketch and measured trajectory points of a 200 nm PS particle showing successful thermophoretic trapping within the region surrounded by laser-heated hexagonal gold patches. The laser illuminates one patch at a time with a rotation frequency of 18.9 Hz and 5 mW light power. (f) Bar graph of the radial position distribution of the trapped particle in (e), which can be fitted with a Rayleigh distribution function. (g) Schematic of the opto-refrigerative tweezer exploiting laser cooling. (h) Measured temperature profile under laser cooling with an illumination intensity of 25.8mW/μm2. White arrows point along the direction of temperature increase, while the pink arrow indicates the thermodiffusive velocity of the particle. (i) Comparison of the time-resolved fluorescence of dye particles trapped by an opto-refregerative tweezer (ORT) and a conventional optical tweezer. (a), (b) Adapted from Ref. [92]. (c), (d) Adapted from Ref. [152]. (e), (f) Adapted from Ref. [156]. (g)–(i) Adapted from Ref. [159].
    Opto-thermoelectric tweezers. (a) Schematic of the solution components when added with CTAC. Left to right: colloidal particles decorated with CTAC, CTAC micelles, Cl− ions. (b) Mechanism of opto-thermoelectric trapping. The two panels on the right illustrate the establishment of the temperature and electrostatic fields and the subsequent particle trapping by electrostatic force. The electric field is induced by the thermophoresis of charged solution components. (c) Hybrid and multi-dimensional assembly of colloidal particles via opto-thermoelectric manipulation. Scale bar: 5 µm (left four panels) and 2 µm (right four panels). (d) Pattern transfer from the graphene substrate (left) to the opto-thermoelectrically trapped PS particles (right). The substrate is patterned by direct laser writing. (a), (b) Adapted from Ref. [87]. (c) Adapted from Ref. [168]. (d) Adapted from Ref. [169].
    Fig. 12. Opto-thermoelectric tweezers. (a) Schematic of the solution components when added with CTAC. Left to right: colloidal particles decorated with CTAC, CTAC micelles, Cl ions. (b) Mechanism of opto-thermoelectric trapping. The two panels on the right illustrate the establishment of the temperature and electrostatic fields and the subsequent particle trapping by electrostatic force. The electric field is induced by the thermophoresis of charged solution components. (c) Hybrid and multi-dimensional assembly of colloidal particles via opto-thermoelectric manipulation. Scale bar: 5 µm (left four panels) and 2 µm (right four panels). (d) Pattern transfer from the graphene substrate (left) to the opto-thermoelectrically trapped PS particles (right). The substrate is patterned by direct laser writing. (a), (b) Adapted from Ref. [87]. (c) Adapted from Ref. [168]. (d) Adapted from Ref. [169].
    Opto-thermoelectrohydrodynamic tweezers. (a) Optical setup of the hybrid electro-thermoplasmonic tweezer. The arrows indicate the direction of the ETP flow. (b) Mapping and vectorial plot of the measured flow velocity. The maximum flow velocity exceeds 10 μm s−1. (c) Schematic of particle trapping with balanced ETP flow and electro-osmotic flow above a gold nanohole array. While the external a.c. field is applied perpendicular to the substrate, the tangential electric component exists due to the non-perfect planar electrode. (d) Dynamic manipulation of an individual protein molecule. The protein (framed gray dot) follows the motion of the laser spot (red dot) and gets re-trapped at the new stagnation site. (a), (b) Adapted from Ref. [25]. (c), (d) Adapted from Ref. [177].
    Fig. 13. Opto-thermoelectrohydrodynamic tweezers. (a) Optical setup of the hybrid electro-thermoplasmonic tweezer. The arrows indicate the direction of the ETP flow. (b) Mapping and vectorial plot of the measured flow velocity. The maximum flow velocity exceeds 10μms1. (c) Schematic of particle trapping with balanced ETP flow and electro-osmotic flow above a gold nanohole array. While the external a.c. field is applied perpendicular to the substrate, the tangential electric component exists due to the non-perfect planar electrode. (d) Dynamic manipulation of an individual protein molecule. The protein (framed gray dot) follows the motion of the laser spot (red dot) and gets re-trapped at the new stagnation site. (a), (b) Adapted from Ref. [25]. (c), (d) Adapted from Ref. [177].
    Optical axial manipulation: pulling using light. (a) Optical solenoid beams with tilted wavefronts. From left to right are three circumstances where the local k-vectors are directed along, perpendicular to, or opposite to the spiral intensity profile. The spiral pitches are kept the same for comparison. (b) Angular distribution of the scattered irradiances of two particles relative to the incident Bessel beam (green dotted line). 0° denotes the forward direction. (c) Schematic showing the gain of a backward recoil force owing to directional SPP excitation. Inset shows the composition of the system. (d) Dependence of J-factor on the geometrics of the hybridized particle and laser beam polarization. (e) Illustration of polarization-controlled particle delivery. Inset shows the geometry of the hybridized particle, which is composed of a glass shell and a thin Au coating. (f) Schematic showing the temperature profile of an illuminated silicon particle, distribution of ionic species, and the resultant opto-thermoelectric field. CTAC surfactants are added in the solution to regulate the charged species. (g) Sequential optical images of long-distance particle pulling towards the fiber tip. Scale bar: 5 µm. (a) Adapted from Ref. [183]. (b) Adapted from Ref. [4]. (c) Adapted from Ref. [181]. (d), (e) Adapted from Ref. [202]. (f), (g) Adapted from Ref. [205].
    Fig. 14. Optical axial manipulation: pulling using light. (a) Optical solenoid beams with tilted wavefronts. From left to right are three circumstances where the local k-vectors are directed along, perpendicular to, or opposite to the spiral intensity profile. The spiral pitches are kept the same for comparison. (b) Angular distribution of the scattered irradiances of two particles relative to the incident Bessel beam (green dotted line). 0° denotes the forward direction. (c) Schematic showing the gain of a backward recoil force owing to directional SPP excitation. Inset shows the composition of the system. (d) Dependence of J-factor on the geometrics of the hybridized particle and laser beam polarization. (e) Illustration of polarization-controlled particle delivery. Inset shows the geometry of the hybridized particle, which is composed of a glass shell and a thin Au coating. (f) Schematic showing the temperature profile of an illuminated silicon particle, distribution of ionic species, and the resultant opto-thermoelectric field. CTAC surfactants are added in the solution to regulate the charged species. (g) Sequential optical images of long-distance particle pulling towards the fiber tip. Scale bar: 5 µm. (a) Adapted from Ref. [183]. (b) Adapted from Ref. [4]. (c) Adapted from Ref. [181]. (d), (e) Adapted from Ref. [202]. (f), (g) Adapted from Ref. [205].
    Optical lateral manipulation enabled by light field and structural asymmetry. (a) Schematic of light carrying SAM (left) and OAM (right). (b) Rotation of a nanodumbbell levitated in a circularly polarized beam. (c) Power spectrum density of the rotational motion in (b). The peak at 2.2 GHz corresponds to the rotation frequency of 1.1 GHz. (d) Experimental setup for producing holographic optical traps carrying transverse phase gradients. (e) Relationship between the traverse speed of a captured colloidal particle v and the linear phase gradient in the transverse plane. The sign and the vector norm of q represent the direction and the magnitude of the lateral phase gradient, respectively. (f) Calculated electric field distribution (pseudo-color image) and Poynting flux profiles (red arrows) of an illuminated plasmonic gammadion. (g) Sequential dark field images showing the rotation of individual motors powered by a single or multiplexed gammadion engines. The illumination wavelengths are 810 nm in the top two panels and 1700 nm in the bottom panel. (h) Generation of the opto-thermoelectric field near an illuminated Janus particle in a defocused light field. (i) Schematics illustrating the self-propelled rotation of a Janus particle trapped in a focused Gaussian beam. FoX and FoY denote the x and y components of the optical force, and FtX and FtY are the x and y components of the opto-thermoelectric force, respectively. Fd is the Stokes drag force. (b), (c) Adapted from Ref. [214]. (d), (e) Adapted from Ref. [225]. (f), (g) Adapted from Ref. [226]. (h), (i) Adapted from Ref. [204].
    Fig. 15. Optical lateral manipulation enabled by light field and structural asymmetry. (a) Schematic of light carrying SAM (left) and OAM (right). (b) Rotation of a nanodumbbell levitated in a circularly polarized beam. (c) Power spectrum density of the rotational motion in (b). The peak at 2.2 GHz corresponds to the rotation frequency of 1.1 GHz. (d) Experimental setup for producing holographic optical traps carrying transverse phase gradients. (e) Relationship between the traverse speed of a captured colloidal particle v and the linear phase gradient in the transverse plane. The sign and the vector norm of q represent the direction and the magnitude of the lateral phase gradient, respectively. (f) Calculated electric field distribution (pseudo-color image) and Poynting flux profiles (red arrows) of an illuminated plasmonic gammadion. (g) Sequential dark field images showing the rotation of individual motors powered by a single or multiplexed gammadion engines. The illumination wavelengths are 810 nm in the top two panels and 1700 nm in the bottom panel. (h) Generation of the opto-thermoelectric field near an illuminated Janus particle in a defocused light field. (i) Schematics illustrating the self-propelled rotation of a Janus particle trapped in a focused Gaussian beam. FoX and FoY denote the x and y components of the optical force, and FtX and FtY are the x and y components of the opto-thermoelectric force, respectively. Fd is the Stokes drag force. (b), (c) Adapted from Ref. [214]. (d), (e) Adapted from Ref. [225]. (f), (g) Adapted from Ref. [226]. (h), (i) Adapted from Ref. [204].
    Spiral, rotational, and translational motions induced by actuator-supported elastic waves. (a) Illustration of the driving mechanism in the opto-thermoelastic scheme, which centers around the interplay between surface friction and the thermally induced elastic waves, with the enabling elements being pulsed light, absorption, and the heating and cooling cycles. (b) Schematic showing the zoomed-in configuration of a fiber-microplate system. The shaded region denotes the contact surface at which the friction force functions as a “fence,” blocking the transmission of thermally excited elastic waves. The inset table links the motion states with the relation between the effectively absorbed power Pabseff and the threshold power PTH, and with the relation among the friction force Ffric, maximum static friction Fslide, and transmittance of the thermally excited elastic waves Tel. (c) Calculated band structure of a rectangular gold plate as an elastic waveguide. L and T modes denote longitudinal and transverse modes, respectively. (d) Sequential optical images showing the spiral motion of a hexagonal gold plate around a static microfiber during one rotation period. Scale bar: 15 µm. (e) Illustration of the rotation of gold microplates with opposite lateral asymmetries. The solid and dashed lines in purple denote the propagation of excited and reflected elastic waves, respectively. (f) Single-pulse locomotion of the gold plate showing its simultaneous crawling towards the SW and the turning relative to the stator. The contact point O should remain unchanged after a complete motion step. (g) Translation of plasmonic nanowires on microfibers driven by pulsed light of different wavelengths. (h) Schematic of the nanowire exhibiting earthworm-like crawling motion in a heating-cooling cycle induced by a single light pulse at 1064 nm. The top two panels are within the heating period, and the lower two panels correspond to the cooling period. (i) Temporal evolution of the displacement of the nanowire’s frontend in the z direction [coordinates are denoted in (h)]. (a) Adapted from Ref. [248]. (b)–(d) Adapted from Ref. [37]. (e), (f) Adapted from Ref. [35]. (g)–(i) Adapted from Ref. [36].
    Fig. 16. Spiral, rotational, and translational motions induced by actuator-supported elastic waves. (a) Illustration of the driving mechanism in the opto-thermoelastic scheme, which centers around the interplay between surface friction and the thermally induced elastic waves, with the enabling elements being pulsed light, absorption, and the heating and cooling cycles. (b) Schematic showing the zoomed-in configuration of a fiber-microplate system. The shaded region denotes the contact surface at which the friction force functions as a “fence,” blocking the transmission of thermally excited elastic waves. The inset table links the motion states with the relation between the effectively absorbed power Pabseff and the threshold power PTH, and with the relation among the friction force Ffric, maximum static friction Fslide, and transmittance of the thermally excited elastic waves Tel. (c) Calculated band structure of a rectangular gold plate as an elastic waveguide. L and T modes denote longitudinal and transverse modes, respectively. (d) Sequential optical images showing the spiral motion of a hexagonal gold plate around a static microfiber during one rotation period. Scale bar: 15 µm. (e) Illustration of the rotation of gold microplates with opposite lateral asymmetries. The solid and dashed lines in purple denote the propagation of excited and reflected elastic waves, respectively. (f) Single-pulse locomotion of the gold plate showing its simultaneous crawling towards the SW and the turning relative to the stator. The contact point O should remain unchanged after a complete motion step. (g) Translation of plasmonic nanowires on microfibers driven by pulsed light of different wavelengths. (h) Schematic of the nanowire exhibiting earthworm-like crawling motion in a heating-cooling cycle induced by a single light pulse at 1064 nm. The top two panels are within the heating period, and the lower two panels correspond to the cooling period. (i) Temporal evolution of the displacement of the nanowire’s frontend in the z direction [coordinates are denoted in (h)]. (a) Adapted from Ref. [248]. (b)–(d) Adapted from Ref. [37]. (e), (f) Adapted from Ref. [35]. (g)–(i) Adapted from Ref. [36].
    Other motion patterns observed on the fiber–plate system. (a) Sequential optical images showing the in-plane rotation of a gold microplate on a microfiber with continuous light pulse injection. The base plane of the gold plate coincides with the x–y plane in the sketch on the left. (b) Mechanism of the in-plane rotation of gold plates on optical fibers, which incorporates electromagnetic interference, light absorption, and the asymmetrically excited longitudinal elastic waves. (c) Comparison between the two cases with a linear absorption profile along the fiber–plate contact line (upper panel) and uniform distribution (lower panel). The x displacements of the two highlighted points at the extremities of the contact line are recorded, showing the close relation between the asymmetry in the displacement field and the asymmetry in the optical absorption. (d) Dynamic recordings of the back-and-forth oscillating motion of a gold plate on a tapered fiber probe. Supercontinuum light was adopted as the light source and delivered into the tapered fiber. (e) Proposed mechanism accounting for the bidirectional locomotion of the gold plate. The oscillation was believed to be the result of competition between the optical pushing force and photophoretic pulling force. (f) Sequential SEM images showing the spiral motion of an antimony telluride plate on a microfiber. The repetition rate of the pulsed light is kept low (230 Hz), and the average power used is 0.1 mW. Scale bar: 5 µm. (g) Ablated Sb2Te3 microplate exhibiting liquid-like motions with a micro-bump contacting the underlying microfiber. The repetition rate of the pulsed laser is 11.5 kHz, and average light power is 5.4 mW. (a)–(c) Adapted from Ref. [5]. (d), (e) Adapted from Ref. [247]. (f), (g) Adapted from Ref. [38].
    Fig. 17. Other motion patterns observed on the fiber–plate system. (a) Sequential optical images showing the in-plane rotation of a gold microplate on a microfiber with continuous light pulse injection. The base plane of the gold plate coincides with the xy plane in the sketch on the left. (b) Mechanism of the in-plane rotation of gold plates on optical fibers, which incorporates electromagnetic interference, light absorption, and the asymmetrically excited longitudinal elastic waves. (c) Comparison between the two cases with a linear absorption profile along the fiber–plate contact line (upper panel) and uniform distribution (lower panel). The x displacements of the two highlighted points at the extremities of the contact line are recorded, showing the close relation between the asymmetry in the displacement field and the asymmetry in the optical absorption. (d) Dynamic recordings of the back-and-forth oscillating motion of a gold plate on a tapered fiber probe. Supercontinuum light was adopted as the light source and delivered into the tapered fiber. (e) Proposed mechanism accounting for the bidirectional locomotion of the gold plate. The oscillation was believed to be the result of competition between the optical pushing force and photophoretic pulling force. (f) Sequential SEM images showing the spiral motion of an antimony telluride plate on a microfiber. The repetition rate of the pulsed light is kept low (230 Hz), and the average power used is 0.1 mW. Scale bar: 5 µm. (g) Ablated Sb2Te3 microplate exhibiting liquid-like motions with a micro-bump contacting the underlying microfiber. The repetition rate of the pulsed laser is 11.5 kHz, and average light power is 5.4 mW. (a)–(c) Adapted from Ref. [5]. (d), (e) Adapted from Ref. [247]. (f), (g) Adapted from Ref. [38].
    Particle propulsion via light illumination. (a) Illustration of the nanoprinting process where particles are released from the flexible donor substrate and transported to the receiver plate. Insets are SEM images of particles deposited on the receiver plate. (b) Simulated temperature profile and the thermal expansion of the PDMS layer via plasmonic absorption of a gold particle. An escaping force from the van der Waal’s adhesion is provided by the thermal expansion of the PDMS layer on the donor substrate. Scale bar: 500 nm. (c) Laser modification of the gold nanoprisms deposited on nonwettable substrate. The laser fluence increases from top to bottom in the left panel and from left bottom to right top in the right panel. Beyond a certain threshold, the deposited particles would be propelled from the substrate. (d) Schematic of the laser-induced forward transfer of nanopatterned particles from a donor to a receiver substrate. (e) Dark field microscopic image of arrays of transferred particles on the receiver substrate. The adopted laser beam has a square profile. (f) SEM image showing the sub-features contained in a single square pixel shown in (e). The initial patterned geometry on the donor substrate was obtained via nanosphere lithography, which explains the hexagonal alignment of particles transferred on the receiver substrate. (g) SEM images showing the propulsion of deposited gold materials with minor ablation upon femtosecond light illumination. The laser pulse intensity is 5.1 mJ/cm2. (a), (b) Adapted from Ref. [249]. (c) Adapted from Ref. [250]. (d)–(f) Adapted from Ref. [257]. (g) Adapted from Ref. [263].
    Fig. 18. Particle propulsion via light illumination. (a) Illustration of the nanoprinting process where particles are released from the flexible donor substrate and transported to the receiver plate. Insets are SEM images of particles deposited on the receiver plate. (b) Simulated temperature profile and the thermal expansion of the PDMS layer via plasmonic absorption of a gold particle. An escaping force from the van der Waal’s adhesion is provided by the thermal expansion of the PDMS layer on the donor substrate. Scale bar: 500 nm. (c) Laser modification of the gold nanoprisms deposited on nonwettable substrate. The laser fluence increases from top to bottom in the left panel and from left bottom to right top in the right panel. Beyond a certain threshold, the deposited particles would be propelled from the substrate. (d) Schematic of the laser-induced forward transfer of nanopatterned particles from a donor to a receiver substrate. (e) Dark field microscopic image of arrays of transferred particles on the receiver substrate. The adopted laser beam has a square profile. (f) SEM image showing the sub-features contained in a single square pixel shown in (e). The initial patterned geometry on the donor substrate was obtained via nanosphere lithography, which explains the hexagonal alignment of particles transferred on the receiver substrate. (g) SEM images showing the propulsion of deposited gold materials with minor ablation upon femtosecond light illumination. The laser pulse intensity is 5.1mJ/cm2. (a), (b) Adapted from Ref. [249]. (c) Adapted from Ref. [250]. (d)–(f) Adapted from Ref. [257]. (g) Adapted from Ref. [263].
    Photothermal deformation-based manipulation. (a) Curling of the SWNT-PC dual-layer structure induced by the CTE mismatch upon light–thermal effects. (b) Schematic showing selective activation of the elementary building block of the artificial muscle. The initial GO-PMMA bilayer structure can be laser-modified into rGO-PMMA (indicated by the shaded areas) to form “joints” of the artificial muscle. Au nanorods are embedded in the bilayer matrix to enhance the light–thermal effects, which would also exhibit wavelength selectivity. (c) Sketch of the VO2/SWNT cantilever beam with micrometer footprint. The other layer that provides the CTE contrast is SiO2. The whole device can be prepared using CMOS fabrication procedures. (d) Actuation mechanism of photothermal-induced moisture change based on an rGO/GO-PDA dual-layer structure. (e) Schematic of the assembly-free light-addressable hand. (f) Light-manipulable arm integrated by pre-deformed dual-layer components. (g) Worm-like crawling of a dual-layer machinery based on the phase transition of thermotropic LCs. (a) Adapted from Ref. [271]. (b), (e) Adapted from Ref. [272]. (c) Adapted from Ref. [273]. (d) Adapted from Ref. [274]. (f) Adapted from Ref. [275]. (g) Adapted from Ref. [276].
    Fig. 19. Photothermal deformation-based manipulation. (a) Curling of the SWNT-PC dual-layer structure induced by the CTE mismatch upon light–thermal effects. (b) Schematic showing selective activation of the elementary building block of the artificial muscle. The initial GO-PMMA bilayer structure can be laser-modified into rGO-PMMA (indicated by the shaded areas) to form “joints” of the artificial muscle. Au nanorods are embedded in the bilayer matrix to enhance the light–thermal effects, which would also exhibit wavelength selectivity. (c) Sketch of the VO2/SWNT cantilever beam with micrometer footprint. The other layer that provides the CTE contrast is SiO2. The whole device can be prepared using CMOS fabrication procedures. (d) Actuation mechanism of photothermal-induced moisture change based on an rGO/GO-PDA dual-layer structure. (e) Schematic of the assembly-free light-addressable hand. (f) Light-manipulable arm integrated by pre-deformed dual-layer components. (g) Worm-like crawling of a dual-layer machinery based on the phase transition of thermotropic LCs. (a) Adapted from Ref. [271]. (b), (e) Adapted from Ref. [272]. (c) Adapted from Ref. [273]. (d) Adapted from Ref. [274]. (f) Adapted from Ref. [275]. (g) Adapted from Ref. [276].
    Tailoring interactions with environments. (a) Schematic of the in-plane photon nudging in the “on” state of the optothermal gate. (b) Rotation, translation, and versatile particle assembly achieved by the optothermally gated photon nudging. Scale bar: 3 µm. (c) Generation and transportation of germanium particles within a laser-liquidized region of a silica fiber. (d) Construction of in-fiber p-n homojunctions in a dual-core fiber. The originally separated p and n type particles are both drawn to the laser spot and become contacted. (e) Schematic illustrating the self-assembly of liquid filament upon nanosecond laser illumination with prescribed periodic perturbation. The light-powered dewetting process leads to the breakup of liquid filaments into periodically arranged hierarchical nanoparticles. In comparison, without preassigned perturbations, the multimode Rayleigh–Plateau instability would result in randomly distributed particles (left top inset). (f) Time evolution of the filament geometry with the prescribed perturbation. The fine lines connecting neighboring first-order particles would dewet into second-order particles shown in (e). (a), (b) Adapted from Ref. [298]. (c), (d) Adapted from Ref. [301]. (e), (f) Adapted from Ref. [307].
    Fig. 20. Tailoring interactions with environments. (a) Schematic of the in-plane photon nudging in the “on” state of the optothermal gate. (b) Rotation, translation, and versatile particle assembly achieved by the optothermally gated photon nudging. Scale bar: 3 µm. (c) Generation and transportation of germanium particles within a laser-liquidized region of a silica fiber. (d) Construction of in-fiber p-n homojunctions in a dual-core fiber. The originally separated p and n type particles are both drawn to the laser spot and become contacted. (e) Schematic illustrating the self-assembly of liquid filament upon nanosecond laser illumination with prescribed periodic perturbation. The light-powered dewetting process leads to the breakup of liquid filaments into periodically arranged hierarchical nanoparticles. In comparison, without preassigned perturbations, the multimode Rayleigh–Plateau instability would result in randomly distributed particles (left top inset). (f) Time evolution of the filament geometry with the prescribed perturbation. The fine lines connecting neighboring first-order particles would dewet into second-order particles shown in (e). (a), (b) Adapted from Ref. [298]. (c), (d) Adapted from Ref. [301]. (e), (f) Adapted from Ref. [307].
    Optical tools for analyzing biochemical molecules and cells. (a) Schematic of a dumbbell geometry formed by a DNA molecule tethered to dielectric particles held in two separate optical tweezers. While the stiffer trap (left) is responsible for stretching the DNA molecule by steering away (via acousto-optic deflector) from the optical trap on the right, the weak trap establishes a force clamp where the particle is held at a zero-stiffness zone offset from the trap center. (b) Recorded temporal evolution of the DNA extension exhibiting step-wise behaviors. The experiment is conducted in a constant-force modality with 18 pN assisting load. The system noise is controlled below 1 Å for high spatial resolution. (c) Schematic of an angular optical tweezer for controlling and measuring the torque in the transcription process against the upstream supercoiling (–) and downstream supercoiling (+). The quartz cylinder is aligned with its extraordinary axis parallel to the transverse plane, so that an alignment torque is exerted on it in the linearly polarized light field. (d) Torque-extension relation in a transient pulsed form. The tested RNA polymerase would receive a pulsed resisting torque while transcribing. When the resisting torque is too large or lasts sufficiently long (pulse duration 5 s versus 0.5 s), the transcription would be deactivated, which is manifested in the extension traces. (e) Experimental setup of a plasmonic nanopore designed for optically trapping and sequencing DNA molecules. The strongly enhanced near fields at the tips of bowtie antennas provide both the anchoring sites for the molecule and the excitation signals for Raman spectroscopy of the exposed nucleotide. Consecutive on and off states of incident light enable the stepwise translocation of the DNA molecule under the electric bias across the nanopore. (f) Illustration of a “fleezer” system in a confocal configuration. The trapping beams and the excitation beam are spatially separated, with the former capturing the particle handlers and the latter focusing on the fluorescently labeled samples. (g) Signals recorded in both the optical tweezer and the fluorescence channels. The jumps shown in the upper panel correspond to the opening of the mRNA hairpin by one-codon steps. The spikes in the lower panel indicate the binding of fluorescently labeled EF-G. (a), (b) Adapted from Ref. [317]. (c), (d) Adapted from Ref. [319]. (e) Adapted from Ref. [324]. (f), (g) Adapted from Ref. [325].
    Fig. 21. Optical tools for analyzing biochemical molecules and cells. (a) Schematic of a dumbbell geometry formed by a DNA molecule tethered to dielectric particles held in two separate optical tweezers. While the stiffer trap (left) is responsible for stretching the DNA molecule by steering away (via acousto-optic deflector) from the optical trap on the right, the weak trap establishes a force clamp where the particle is held at a zero-stiffness zone offset from the trap center. (b) Recorded temporal evolution of the DNA extension exhibiting step-wise behaviors. The experiment is conducted in a constant-force modality with 18 pN assisting load. The system noise is controlled below 1 Å for high spatial resolution. (c) Schematic of an angular optical tweezer for controlling and measuring the torque in the transcription process against the upstream supercoiling (–) and downstream supercoiling (+). The quartz cylinder is aligned with its extraordinary axis parallel to the transverse plane, so that an alignment torque is exerted on it in the linearly polarized light field. (d) Torque-extension relation in a transient pulsed form. The tested RNA polymerase would receive a pulsed resisting torque while transcribing. When the resisting torque is too large or lasts sufficiently long (pulse duration 5 s versus 0.5 s), the transcription would be deactivated, which is manifested in the extension traces. (e) Experimental setup of a plasmonic nanopore designed for optically trapping and sequencing DNA molecules. The strongly enhanced near fields at the tips of bowtie antennas provide both the anchoring sites for the molecule and the excitation signals for Raman spectroscopy of the exposed nucleotide. Consecutive on and off states of incident light enable the stepwise translocation of the DNA molecule under the electric bias across the nanopore. (f) Illustration of a “fleezer” system in a confocal configuration. The trapping beams and the excitation beam are spatially separated, with the former capturing the particle handlers and the latter focusing on the fluorescently labeled samples. (g) Signals recorded in both the optical tweezer and the fluorescence channels. The jumps shown in the upper panel correspond to the opening of the mRNA hairpin by one-codon steps. The spikes in the lower panel indicate the binding of fluorescently labeled EF-G. (a), (b) Adapted from Ref. [317]. (c), (d) Adapted from Ref. [319]. (e) Adapted from Ref. [324]. (f), (g) Adapted from Ref. [325].
    Measurement of the instantaneous velocity of Brownian particles in an optical tweezer platform. (a) Measured MSD (symbols) of a trapped particle compared to Einstein’s deduction (dashed lines) and the prediction of the Langevin equation (solid lines) at different air pressures. (b) MSD of a Brownian particle at short time scales (t≪tp) showing ballistic behaviors. The dashed-dotted line is deduced from the ballistic assumption obeying the equation referred to by the arrow. The measurements were conducted in a vacuum chamber to attain the under-damped condition, where the air pressure can be adjusted. Adapted from Ref. [98].
    Fig. 22. Measurement of the instantaneous velocity of Brownian particles in an optical tweezer platform. (a) Measured MSD (symbols) of a trapped particle compared to Einstein’s deduction (dashed lines) and the prediction of the Langevin equation (solid lines) at different air pressures. (b) MSD of a Brownian particle at short time scales (ttp) showing ballistic behaviors. The dashed-dotted line is deduced from the ballistic assumption obeying the equation referred to by the arrow. The measurements were conducted in a vacuum chamber to attain the under-damped condition, where the air pressure can be adjusted. Adapted from Ref. [98].
    Photophoretic trapping for volumetric display. (a) Schematic illustration of the photophoretic trap display. Individual absorptive particles can be levitated in the dark region of a bottle beam (trapping beam) and scanned to form images at a speed beyond what is required by the persistence of vision. RBG lasers are collinearly aligned with the trapping beam to illuminate the trapped particle. (b), (c) Three-dimensional images exemplifying the capability of the proposed volumetric display. (b) The as-produced images can be received from arbitrary angles free of clipping. (c) “Wrap around” images can be created surrounding a 3D-printed arm model, whose imaging effect is not affected by the obstruction of real physical objects as what would appear in conventional holograms. Adapted from Ref. [342].
    Fig. 23. Photophoretic trapping for volumetric display. (a) Schematic illustration of the photophoretic trap display. Individual absorptive particles can be levitated in the dark region of a bottle beam (trapping beam) and scanned to form images at a speed beyond what is required by the persistence of vision. RBG lasers are collinearly aligned with the trapping beam to illuminate the trapped particle. (b), (c) Three-dimensional images exemplifying the capability of the proposed volumetric display. (b) The as-produced images can be received from arbitrary angles free of clipping. (c) “Wrap around” images can be created surrounding a 3D-printed arm model, whose imaging effect is not affected by the obstruction of real physical objects as what would appear in conventional holograms. Adapted from Ref. [342].
    (a) Schematic of the fiber–plate system used for laser scanning. The gold plate as the rotor in the machinery exhibits high reflectivity at the incident wavelength, thus functioning as a micromirror that reflects the light beam as it rotates. (b) Sequential optical images showing the laser beam deflected with time. The rotation speed of the micromirror is 0.1 rad/s. (c) Comparison between the experimentally measured and calculated beam deflection with time. The stepwise feature can be clearly seen in the experimental data. (d) Schematic of a fiber-based photonic integrated circuit with plasmonic nanowires functioning as the moving elements. (e) Basic setup of the on-chip realization of opto-thermo-mechanical actuation based on waveguide platforms. (f) Schematic of on-chip multiplexed actuation of plasmonic vehicles. (a)–(c) Adapted from Ref. [35]. (d) Adapted from Ref. [36].
    Fig. 24. (a) Schematic of the fiber–plate system used for laser scanning. The gold plate as the rotor in the machinery exhibits high reflectivity at the incident wavelength, thus functioning as a micromirror that reflects the light beam as it rotates. (b) Sequential optical images showing the laser beam deflected with time. The rotation speed of the micromirror is 0.1 rad/s. (c) Comparison between the experimentally measured and calculated beam deflection with time. The stepwise feature can be clearly seen in the experimental data. (d) Schematic of a fiber-based photonic integrated circuit with plasmonic nanowires functioning as the moving elements. (e) Basic setup of the on-chip realization of opto-thermo-mechanical actuation based on waveguide platforms. (f) Schematic of on-chip multiplexed actuation of plasmonic vehicles. (a)–(c) Adapted from Ref. [35]. (d) Adapted from Ref. [36].
     Optical ForcePhotophoretic ForceLight-Induced Acoustic Radiation ForceLight-Induced Deformation Effects
    MechanismLight momentum channelLight energy channelLight energy channelLight energy channel
    Momentum transfer between light and objects1. Photothermal effects1. Opto-thermo-mechanical coupling1. Opto-thermo-mechanical coupling
    2. Nonuniform collisions between the particle and air molecules2. Momentum transfer between acoustic waves and objects2. Internal force-driven mechanism
    Intuitive expressionaFopt=2rP/cFp=αP/3vmFacou=2βPtran/vs
    MagnitudebpN∼pN–nN or beyondμNμN
    Working environmentFluid domainFluid domainSolid domainSolid domain
    Table 1. Properties of Different Light-Induced Forces/Effects.
    Qiannan Jia, Wei Lyu, Wei Yan, Weiwei Tang, Jinsheng Lu, Min Qiu. Optical manipulation: from fluid to solid domains[J]. Photonics Insights, 2023, 2(2): R05
    Download Citation