Chiral ligand conjugated transition metal oxide nanoparticles (NPs) are a promising platform for chiral recognition, biochemical sensing, and chiroptics. Herein, we present chirality-based strategy for effective sensing of mercury ions via ligand-induced chirality derived from metal-to-ligand charge transfer (MLCT) effects. The ligand competition effect between molybdenum and heavy metal ions such as mercury is designated to be essential for MLCT chirality. With this know-how, mercury ions, which have a larger stability constant () than molybdenum, can be selectively identified and quantified with a limit of detection (LOD) of 0.08 and 0.12 nmol/L for D-cysteine and L-cysteine (Cys) capped NPs. Such chiral chemical sensing nanosystems would be an ideal prototype for biochemical sensing with a significant impact on the field of biosensing, biological systems, and water research-based nanotoxicology.
1. INTRODUCTION
Ligand-induced chirality in semiconductor nanoparticles (NPs) has revolutionized the motif of inorganic material-based nanotechnology, because it timely opens the floodgate of these materials for promising applications in chiral recognitions and synthesis [1–5], bioimaging and display devices [6–15], and metamaterials in advanced optical devices [16–19] simply via interactions between the chiral ligands and achiral core [19–29]. Recently, ligand-induced chiral transition metal oxide ceramics have attracted tremendous interest not only due to their existing applications in optoelectronics [12,18,30] and biomedicine [31,32], but also their ability to provide incisive information on the metal-ligand interactions in terms of chiroptical activities. With both chemical linkage and coordination effects, electronic transitions between metal and ligands induce chiral responses in the visible region with a -factor up to the order of , which is 1 to 2 orders higher than that of traditional chiral ligand capped cadmium chalcogenide, where -factor is defined as , and is the absorbance difference between left- and right-handed circularly polarized light. Kotov and his coworkers [18], for instance, demonstrated that paramagnetic NPs with crystal lattice distortions caused by the chiral ligands exhibited both chiroptical activity in the visible range and intensive magnetic field-induced light modulation in the ultraviolet (UV) range, offering a versatile tool box for new technologies and knowledge at the nexus of chirality and magnetism. Moreover, their follow-up research work [33] showed the observation of induced chirality in NPs via using proline (Pro) and aspartic acid (Asp) as surface ligands. The formed C-O-W linkages and weak coordination between amino groups and the core are found to be essential for the chiral metal-to-ligand charge transfer (MLCT) in the visible range and chiroplasmonic band in the near-infrared (NIR) region, respectively. To go further, the mentioned strong MLCT band is as well witnessed in our previous work [34] in a sub-stoichiometric chiral Cys-capped system with a large -factor close to , in which the MLCT band transition is contributed by the transition from the metal- orbitals coupling with ligand-based and orbitals. The -factor originated from the MLCT band is about 100 times higher compared with the -factor that comes from chiroplasmonic band transition in the NIR region [34]. Such strong chiroptical activity naturally motivates us to raise questions as this: is it possible to affect the MLCT chirality simply via the ligands, and can the materials be applied in the field of nanotechnology with specific applications such as chiral sensing?
To address the question, it is demonstrated herein chiral Cys reduced and capped NPs () can serve as platform for ultralow concentration detection of mercury ions () in water based on circular dichroism (CD) spectropolarimetry. The observed low limit of detection (LOD) and high selectivity on due to the large stability constant (log ) of highlight the potential of chiral NPs in the realm of chiral sensing and recognition. On the other hand, owing to the ligand competition effect, the surface ligand density of the chiral will be greatly impacted during introduction. The variation of ligand density linked to MLCT chirality with respect to CD response would unravel the chirogenesis and fundamental relations of ligand density versus MLCT chirality, providing intuitive experimental basis for studying the chiral electronic transitions in transition metal oxide ceramics.
2. EXPERIMENT SECTION
A. Materials
Molybdenum disulfide (, 99.5%) powder and hydrogen peroxide (, GR, mass fraction 30% in ) solution were purchased from Aladdin. L-Cys (98%), D-Cys (99%), and all soluble heavy metallic salts were obtained from Sigma-Aldrich. All chemicals were not purified for using as received. All heavy metal ion solution was prepared by adding the corresponding salt in water. The water that was used in all experiments had a resistivity higher than .
Sign up for Photonics Research TOC. Get the latest issue of Photonics Research delivered right to you!Sign up now
B. Synthesis of Aqueous Molybdenum Trioxide Nanoparticles
The preparation of molybdenum trioxide NPs was reported previously [1,34]. First of all, 80 mg pristine powder was dissolved in 46.25 mL water in a beaker. Then, the dispersion was treated with sonication at room temperature. 3.75 mL solution was added into the dispersion subsequently. The mixture was kept constantly stirred until the color turned from black to yellow. It would last about 20 h. Then, the dispersion was heated at about 70°C to remove excess . After about 1 h, the color of the dispersion would turn to transparent, which means the successful synthesis of NPs.
C. Preparation of Chiral Nanodots
The chiral nanodots were prepared according to the procedure given in the literature [1,31]. The as-prepared nanocrystals solution could be reduced and capped with the presence of chiral Cys molecules. In a typical process, 65 mg D-Cys was added into 1.5 mL solution that was obtained previously. Subsequently, the mixture was treated with sonication for 5 min. After that, the mixture was placed in the dark for one day to make sure that it could react sufficiently. The same treatment was carried out for obtaining D-Cys molecule capped nanodots.
D. Purification of Chiral Cys Capped Nanodots
After obtaining chiral molecule capped nanodots, the solution should be purified for further use. As in a typical process, the resulting solution was treated with centrifugation at 14,000 r/min for 20 min. Then, the supernatant was taken out from the centrifuge tube. The precipitate was dissolved in water. The mixture was centrifuged again at 6000 r/min for 10 min. After that, the supernatant was re-dissolved into another centrifuge tube. Finally, the mixture was again centrifuged at 5000 r/min for 5 min. The precipitate was dissolved in water for further use.
E. Characterizations
The UV-visible absorption measurement was carried out using a TU-1901 double-beam UV-Vis spectrophotometer (Beijing Purkine General Instrument Co., Ltd., China). For X-ray photoelectron spectroscopy (XPS) measurements, the samples were prepared by dropping the as-prepared solution on a silicon substrate, and the experiment was performed on a Thermo Scientific K-Alpha system. CD experiments were realized on a JASCO J-1500 CD spectrometer. The scan rate was 20 nm/min, and the data pitch was 0.1 nm. For all CD experiments, Milli-Q water with a quartz cuvette (0.1 cm optical path length from Hellma) was used. The transmission electron microscopy (TEM) pictures were captured by a Tecnai F30 microscope with operating voltage at 300 kV. A thermogravimetric analysis (TGA) experiment was conducted via Perkin Elmer STA 6000. The sample for measurement was dried under inert gas atmosphere. The measurement region is from 30 K to 800 K with a heating speed of 5°C per minute and 20°C per minute for the cooling process.
F. Stimulation Method
The nanocluster establishment and quantum chemical calculations were conducted with density functional theory (DFT). Ground state geometries were initiated and optimized at minimal energy state. The UV and CD simulated spectra were calculated at time-dependent density functional theory (TD-DFT) based on Gaussian 09 software. All the TD-DFT calculations were utilizing a B3LYP and LanL2DZ basis that was set for all the elements in simulation [35–37]. The small NPs capped with L- and D-Cys nanoclusters were constructed as a tetragonal crystal structure to form neutral charge geometry to simulate the interactions between the molybdenum oxide cluster and chiral light.
G. Calculation of Ligand Density
The ligand density of NPs could be determined by the mass loss curve owing to the desorption and decomposition of the chemisorbed molecules [33,38]. First of all, the NPs for calculating were assumed to be spherical, and the diameter could be regarded as the average value of each NP obtained from the TEM image. The mass of an individual NP could be expressed as where is the average diameter of NPs and is the density of the NP. The total amount of ligands () and () in the system was obtained as where is the total mass of sample for TGA measurement and is the mass fraction of Cys molecules on the NP surface. Then, the total number () for each sample was determined as Finally, the ligand density could be determined as where is the Avogadro constant and is the molecular weight of Cys. Here, was 22.2 nm according to the TEM size distribution. was assumed to be equal to the bulk density (). was equal to (CAS52-90-4).
3. RESULTS AND DISCUSSION
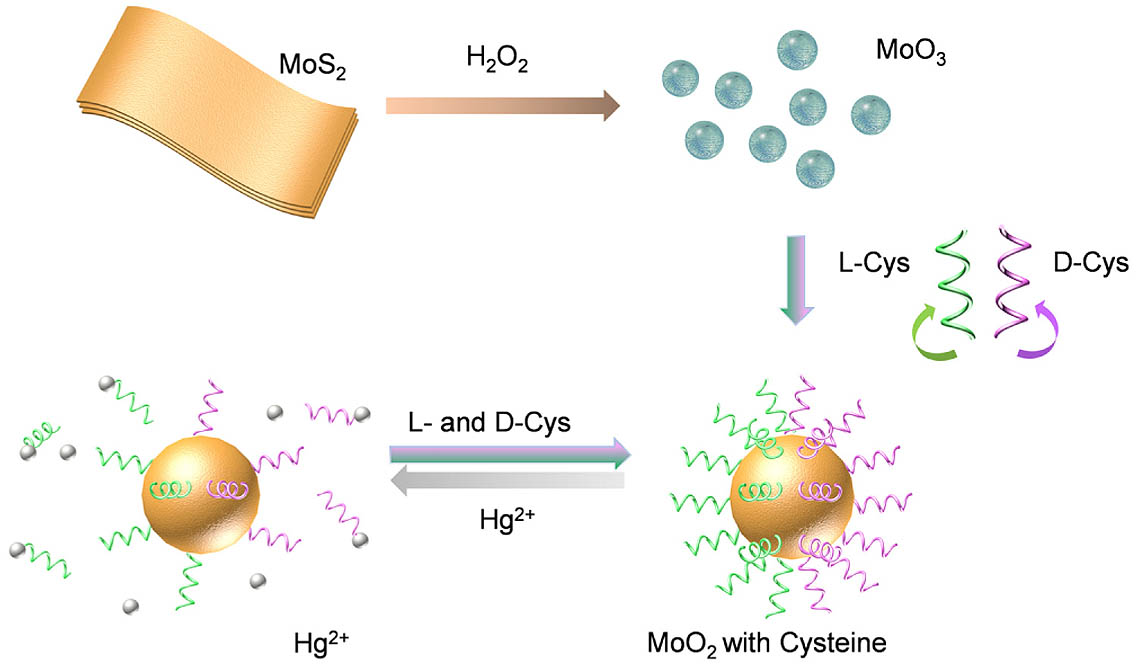
Figure 1.Illustration of the synthesis process of chiral NPs and their application for sensing.
Figure 2.(a) TEM image of NPs. The corresponding scale bar is 100 nm. (b) Histogram distribution of the diameter of NPs. Measurements of (c) circular dichroism spectrum and (d) absorption spectrum of (black line), (red line), and NPs (blue line). XPS spectra of (e) NPs and (f) NPs with deconvoluted molybdenum 3d peaks. The blue and orange peak areas are corresponding to the different valence states of Mo(VI) and Mo(IV), respectively.
The chiroptical property of the NPs and Cys capped NPs is characterized by a CD spectrometer along with absorption measurement [Figs. 2(c) and 2(d)]. Without chiral ligands, the NPs are inactive in CD, while in the case of Cys reduced NPs, strong CD responses are recorded with opposite line shape depending on the enantiomer of chiral molecules used for the synthesis. Due to the MLCT effect, the observed CD signal is located in the visible range (350–650 nm) accompanied with merging UV-Vis absorption peaks within the same region (around 380 and 560 nm). The -factors, which are calculated based on measured CD and absorption signal, are about at 384 nm and at 568 nm, respectively. The XPS survey scan is performed for both and D samples. Figures 2(e) and 2(f) also plot the Mo 3d orbital spectra before and after reductive treatment under Cys molecules. Figure 2(e) shows two apparent peaks located at 233.15 and 236.35 eV, which correspond to the and orbitals for the Mo(VI), respectively. The result indicates that typical has been obtained. After the Cys reduction, the XPS peaks of Mo show obvious downshift, which move to 229 and 232.8 eV, respectively, as illustrated in Fig. 2(f) [34,39]. These binding energies are indexed as and orbitals for the Mo(IV). It confirms that excessive Cys could completely reduce the Mo in to the IV state without any intermediate states.
Figure 3.Chiroptical sensing of using NPs. (a) CD and (b) absorption measurements for mixing with aqueous and NPs solution. The concentration of in the mixture varied from 0.1 nM to 30 nM. (c) Calculated -factor curves of specimens in (a). (d) Differences of -factor [values at 384 nm shown in (c)] versus concentration and corresponding fitting curve. The inset image is the calibration plot.
Apparently, with the increase of concentration, the recorded CD and UV signals, no matter for or systems, decrease gradually [Figs. 3(a) and 3(b)], which indicates the chemical reactions are initiated between and Cys molecules that are located on the surface.
Considering that the absorption of the chiral system may change probably due to the volume increment or aggregations caused by introduction of , anisotropic -factor is used here for evaluating the sensing performance to rule out the interference of concentration variation. At low concentration, the CD signal of the mixture is indistinguishable for both and systems [as shown in Fig. 3(a)]. With the assistance of -factor, the change of chiroptical property is better elucidated even when an ultrasmall amount (0.1 and 1 nM, 1 nM = 1 nmol/L) of is added to the chiral system as shown in Fig. 3(c) (black and red lines, for example). Moreover, Fig. 3(c) shows the relation of versus -factor for the optical activity, suggesting a clear decreasing of -factor values with the increase of . Figure 3(d) states the relationship between the increment of -factor at around 384 nm and concentration, where and are the anisotropy factor without and with the presence of in solutions. The scatter plot and fitting curves of show a growth tendency with the increase of concentration, which indicates that Cys molecules loaded at the surface of NPs had reacted with [Fig. 3(d)]. A linear increment of anisotropy factor at 384 nm versus the concentration ranging from 0.1 to 4 nM is established with correlation coefficients of 0.992 (for system) and 0.990 (for system). The LOD is determined to be 0.12 nM and 0.08 nM for and , respectively. The LOD for detection is evaluated by , where is the standard deviation of -factor measured in the absence of , and is the slope of the calibrated plot. For comparison, the analytical characteristics of some sensors are summarized in Table 1. Obviously, the LOD of our sensing system is comparable to or better than the previously reported sensors based on surface-enhanced Raman scattering (SERS), absorption, PL, electrochemical and CD spectrum.
Comparison of the Proposed Probe with Previously Reported Sensors Based on Different Methodsa
Figure 4.(a) TGA curves of NPs with different amounts of mercury after dialysis. (b) Ligand density varies with mercury ion concentrations. (c) CD and (d) absorption spectra of pure NPs as well as mixing with (10 nM in the mixture) under different reaction times.
Figure 5.TD-DFT simulation for different amounts of D-Cys capped nanoclusters. Calculated frontier molecular orbital of (a), (c) HOMO and (b), (d) LUMO for one Cys molecule capped and six Cys molecule capped nanoclusters. Calculated (e) CD spectra and (f) absorption spectra.
Figure 6.Selectivity of -based sensor. (a) CD spectra of solution mixed with different heavy metal ions: , , , , , and . (b) CD signal at 384 nm of mixtures measured in (a). The concentrations of all metal ions are settled at 10 nM.
In summary, Cys-induced optically active NPs are synthesized and applied for detection with high precision. Due to the big stability constant of , such a chiral sensing system is exceptionally sensitive to while inactive to other traditional heavy metal ions that coexist in waste water. Further CD observations, TGA analysis, and TD-DFT-based simulations confirm the ligand competition phenomenon between mercury and molybdenum, which unveils the underlying chirogenesis of MLCT chirality. Such transition metal oxide-based chiral NPs would be potential candidates for effective sensing of providing new horizons to the areas of biochemical sensing, chiroptics, and environmental remediation.