• Acta Optica Sinica
  • Vol. 40, Issue 16, 1630002 (2020)
Chang Liu1、2、3, Hailiang Shi1、2、3, Zhiwei Li1、3, Chunqiang Wu4, Chengli Qi4, and Wei Xiong1、2、3、*
Author Affiliations
  • 1Anhui Institute of Optics and Fine Mechanics, Hefei Institute of Physical Science, Chinese Academy of Sciences, Hefei, Anhui 230031, China
  • 2University of Science and Technology of China, Hefei, Anhui 230026, China
  • 3Key Laboratory of Optical Calibration and Characterization of Chinese Academy of Sciences, Hefei, Anhui 230031, China
  • 4Key Laboratory of Radiometric Calibration and Validation for Environmental Satellite, National Satellite Meteorological Center, Beijing 100081, China
  • show less
    DOI: 10.3788/AOS202040.1630002 Cite this Article Set citation alerts
    Chang Liu, Hailiang Shi, Zhiwei Li, Chunqiang Wu, Chengli Qi, Wei Xiong. Detection and Correction of Fringe Count Error in Spaceborne Infrared Hyperspectral Fourier Transform Spectrometer[J]. Acta Optica Sinica, 2020, 40(16): 1630002 Copy Citation Text show less
    Interferogram diagram when FCE occurs
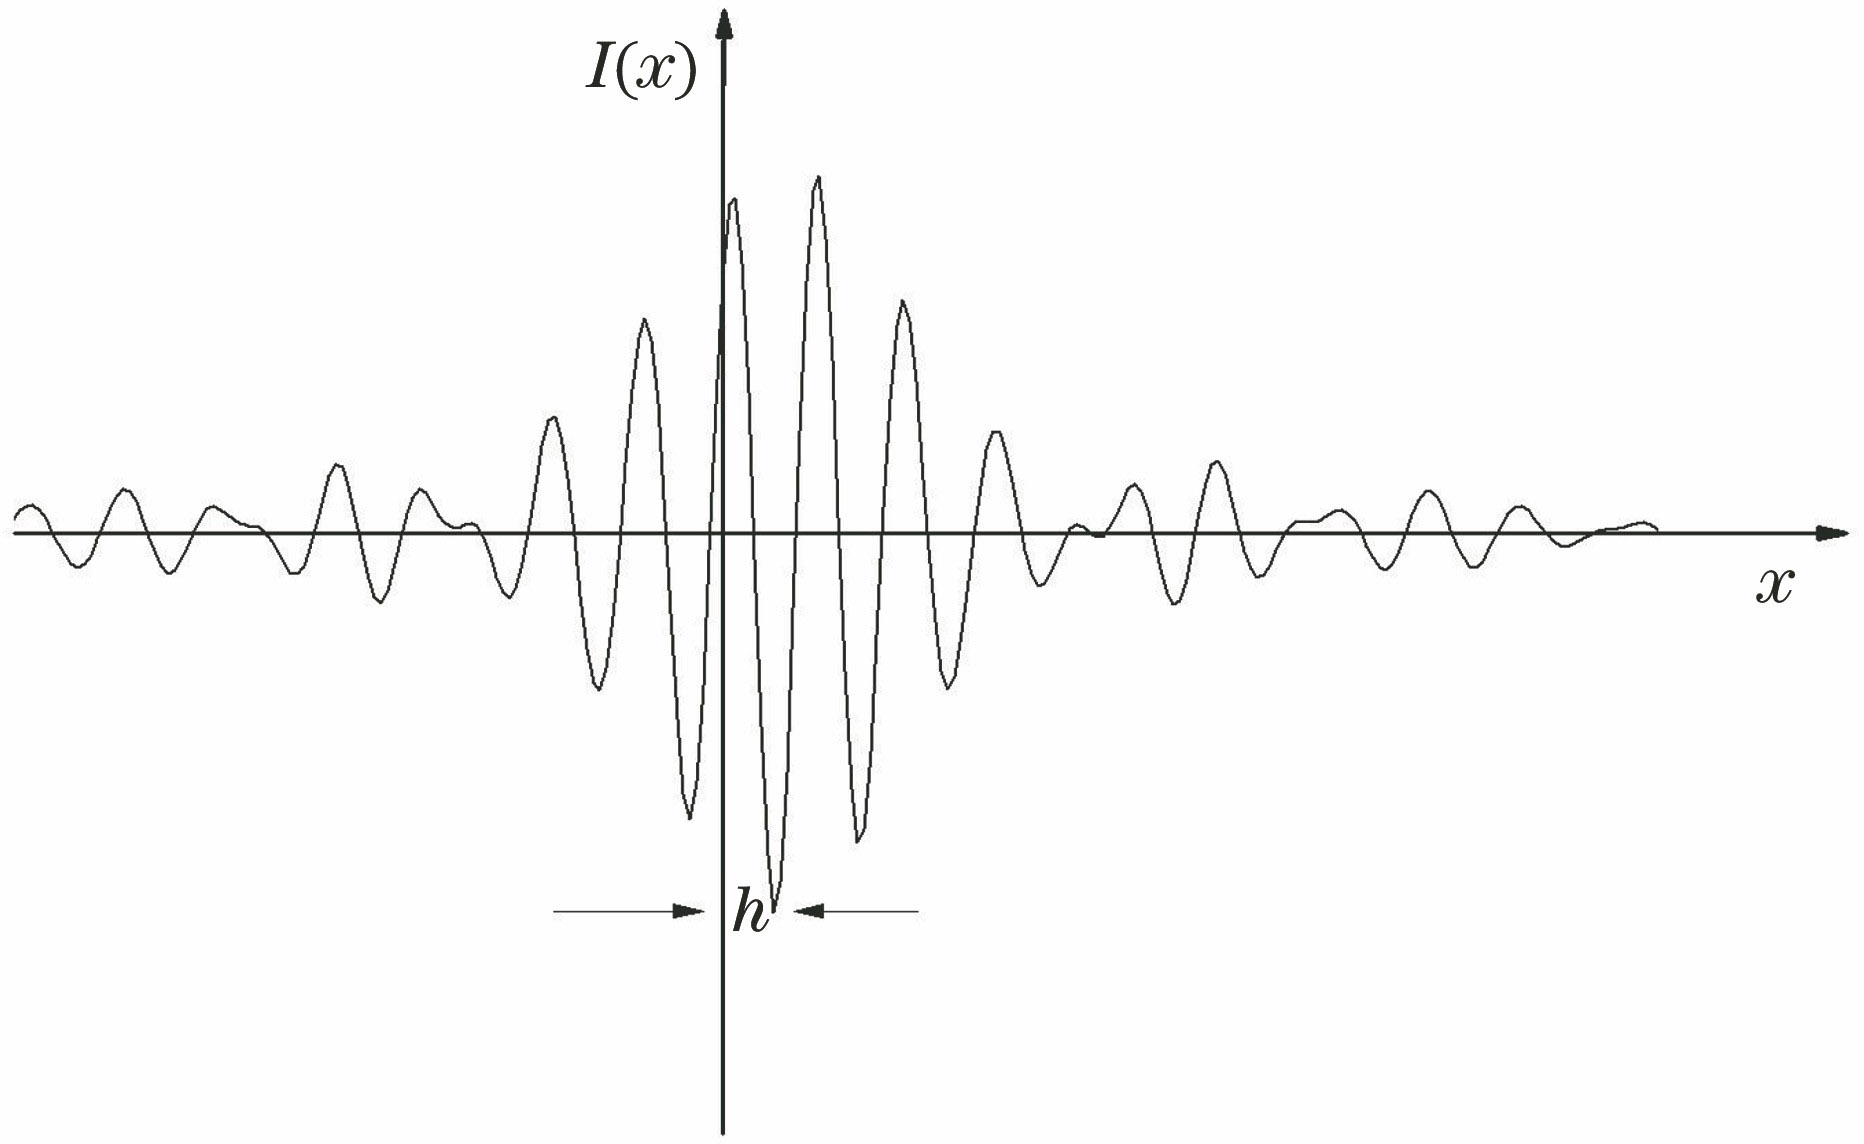
    Fig. 1. Interferogram diagram when FCE occurs
    Effect of FCE at different positions on phase
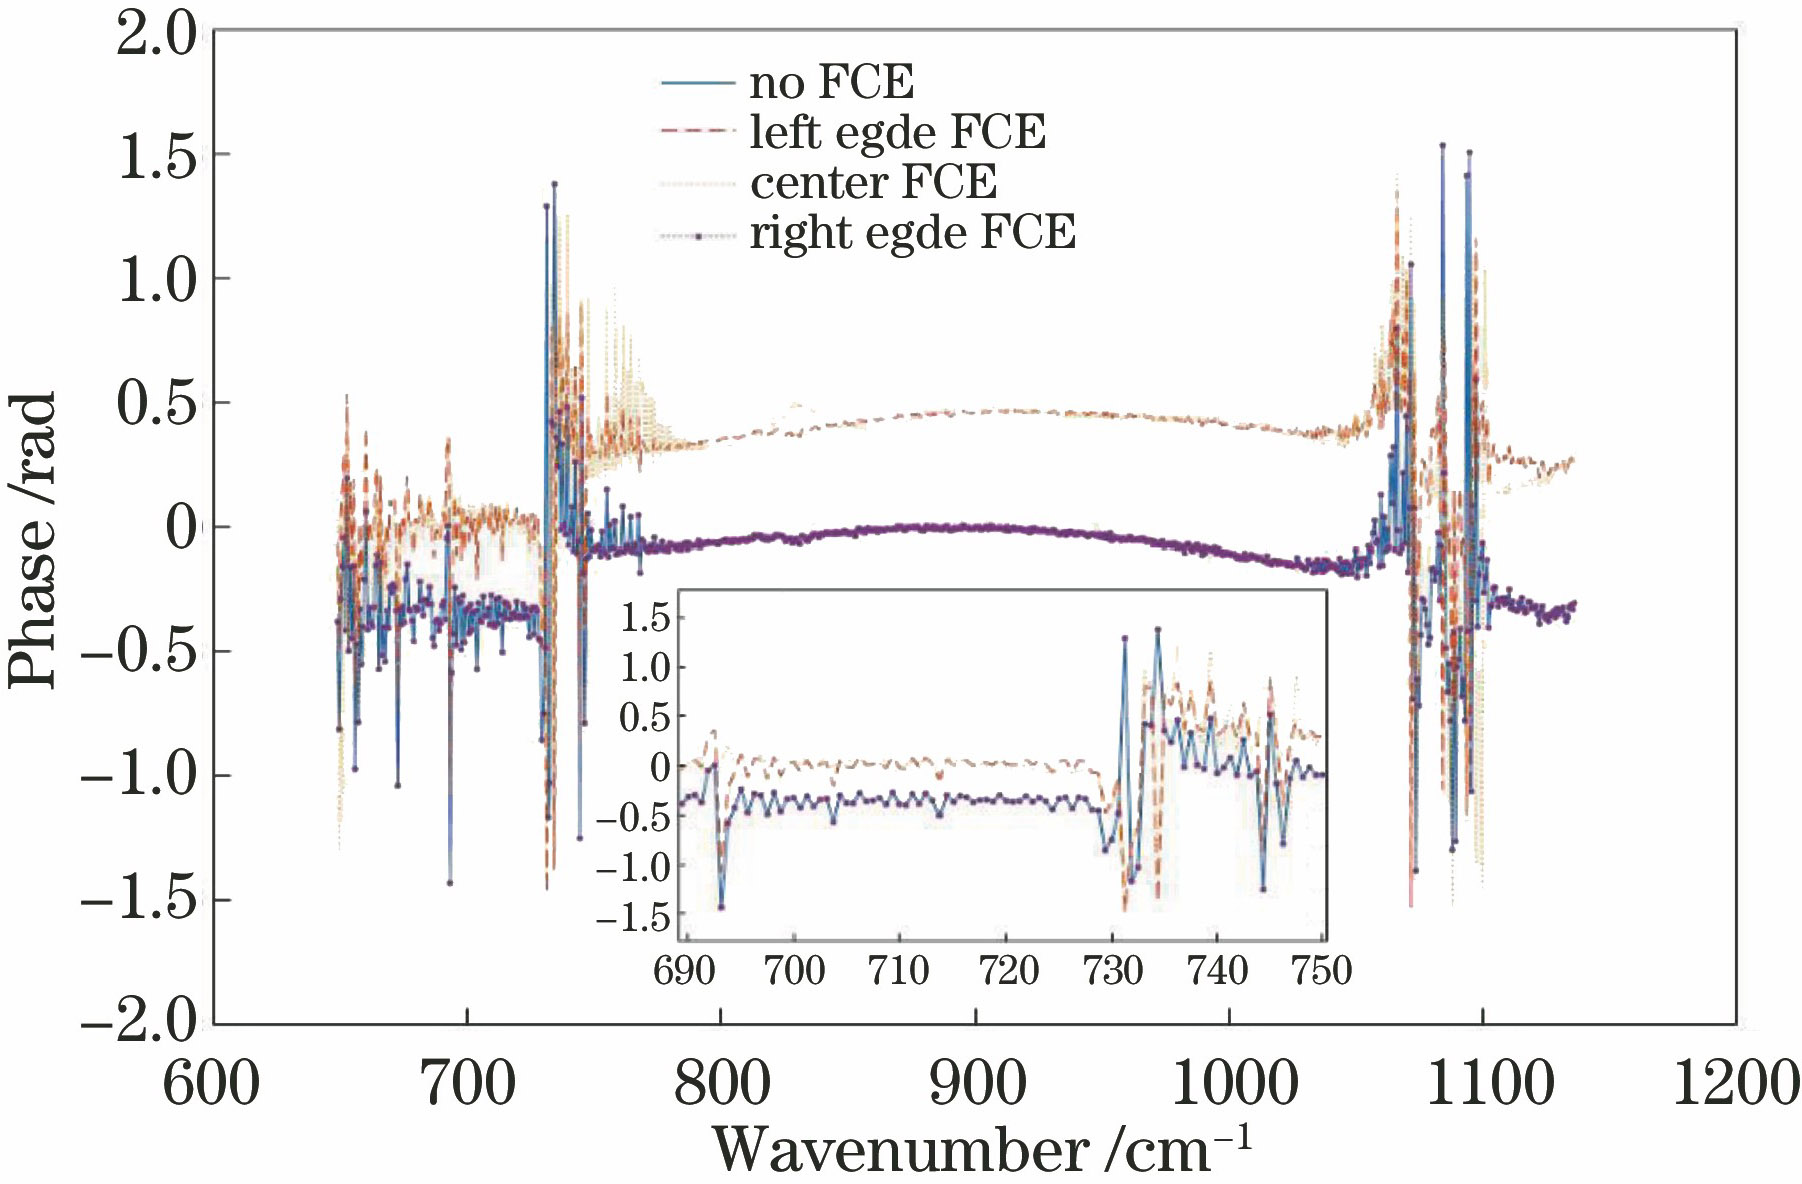
    Fig. 2. Effect of FCE at different positions on phase
    Effect of FCE at different positions on spectrum. (a) Overall view; (b) partial enlargement
    Fig. 3. Effect of FCE at different positions on spectrum. (a) Overall view; (b) partial enlargement
    Effects of FCE at different positions on phase difference and spectral deviation. (a) Effect on phase difference; (b) effect on spectral deviation
    Fig. 4. Effects of FCE at different positions on phase difference and spectral deviation. (a) Effect on phase difference; (b) effect on spectral deviation
    Schematics of FCE detection. (a) Interference data with FCE; (b) phase extraction function; (c) phase of phase extraction function
    Fig. 5. Schematics of FCE detection. (a) Interference data with FCE; (b) phase extraction function; (c) phase of phase extraction function
    FCE calibration results. (a) Spectral phase of the interferogram with FCE; (b) linearly fits the phase extraction function; (c)phase contrast chart after FCE correction; (d) spectrum contrast chart after FCE correction
    Fig. 6. FCE calibration results. (a) Spectral phase of the interferogram with FCE; (b) linearly fits the phase extraction function; (c)phase contrast chart after FCE correction; (d) spectrum contrast chart after FCE correction
    FCE correction in earth scene. (a) Phase extraction function linear fitting in earth scene; (b) phase comparison before and after correction
    Fig. 7. FCE correction in earth scene. (a) Phase extraction function linear fitting in earth scene; (b) phase comparison before and after correction
    Test results of actual data
    Fig. 8. Test results of actual data
    ParameterValue
    Spectral range /cm-1648 to 1136
    Spectral resolution /cm-10.625
    Sampling point19456
    Lost point1
    Lost positionleft edge,center,right edge
    Table 1. FCE error simulation parameters
    ParameterTechnical indicator
    Scan cycle /s10
    Residence steps40
    Effective residence steps33
    Scan times30
    Wave bandLongwave, midwave,shortwave
    Table 2. Instrument related parameters
    FCE appear positionCalculatedoffset pointsFitted variancePhase differencebefore correctionPhase differenceafter correction
    One point lost1.03190.2352339.228621.1
    LeftThree points lost3.03750.23051045.235.2764
    Five points lost5.17130.2348693.924428.8488
    One point lost0.93628.0109339.219521.0571
    CenterThree points lost3.03530.18531045.335.2145
    Five points lost5.16740.1694694.76728.7564
    Table 3. Algorithm detection and correction under different FCE conditions
    Chang Liu, Hailiang Shi, Zhiwei Li, Chunqiang Wu, Chengli Qi, Wei Xiong. Detection and Correction of Fringe Count Error in Spaceborne Infrared Hyperspectral Fourier Transform Spectrometer[J]. Acta Optica Sinica, 2020, 40(16): 1630002
    Download Citation