
Dong-Pyo Han, Motoaki Iwaya, Tetsuya Takeuchi, Satoshi Kamiyama, Isamu Akasaki. Space-charge effect on photogenerated-current and -voltage in III-nitride optoelectronic semiconductors[J]. Photonics Research, 2021, 9(9): 1820
- Photonics Research
- Vol. 9, Issue 9, 1820 (2021)
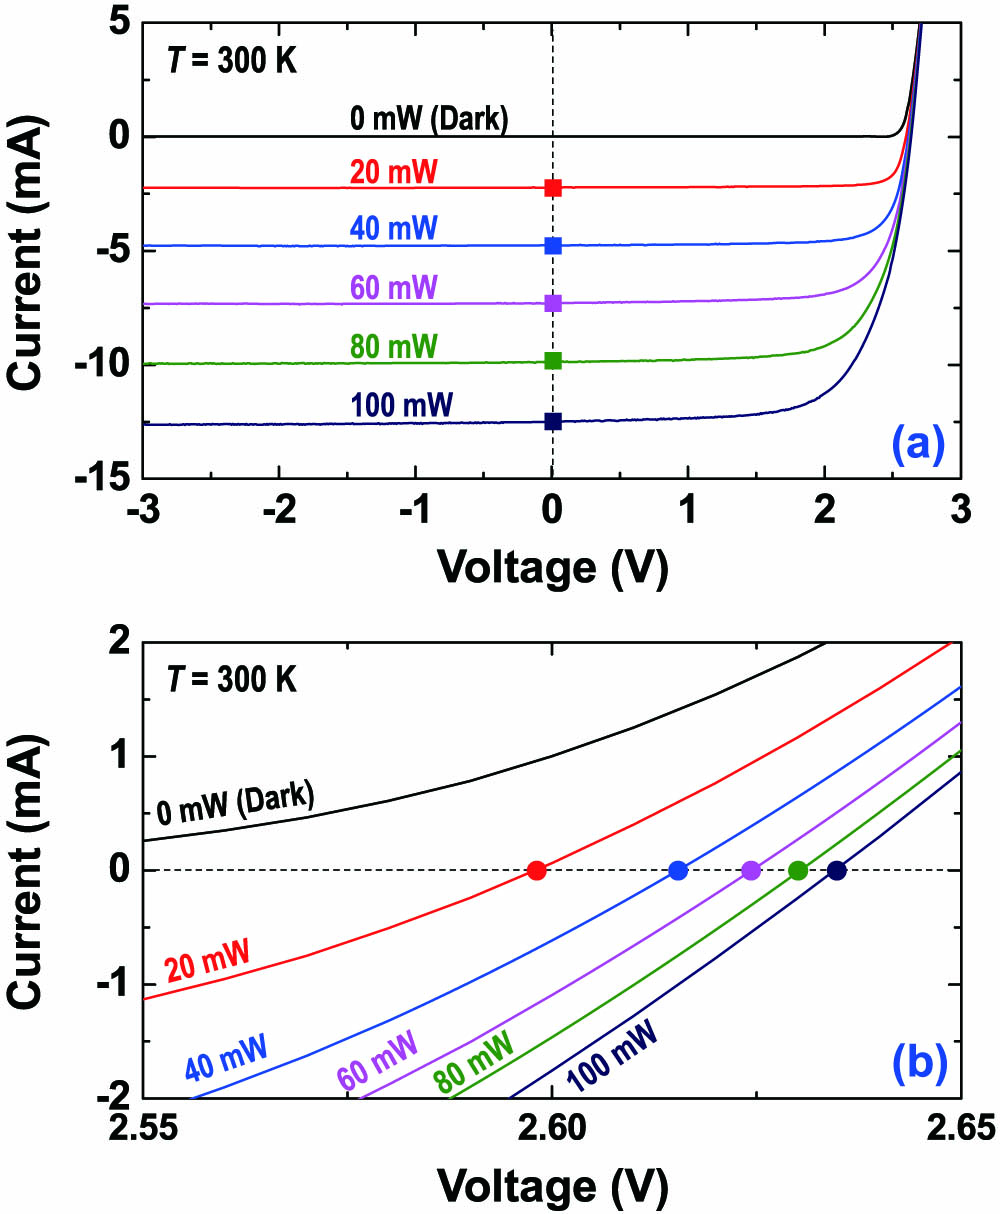
Fig. 1. (a) Excitation-power-dependent I – V I SC V OC
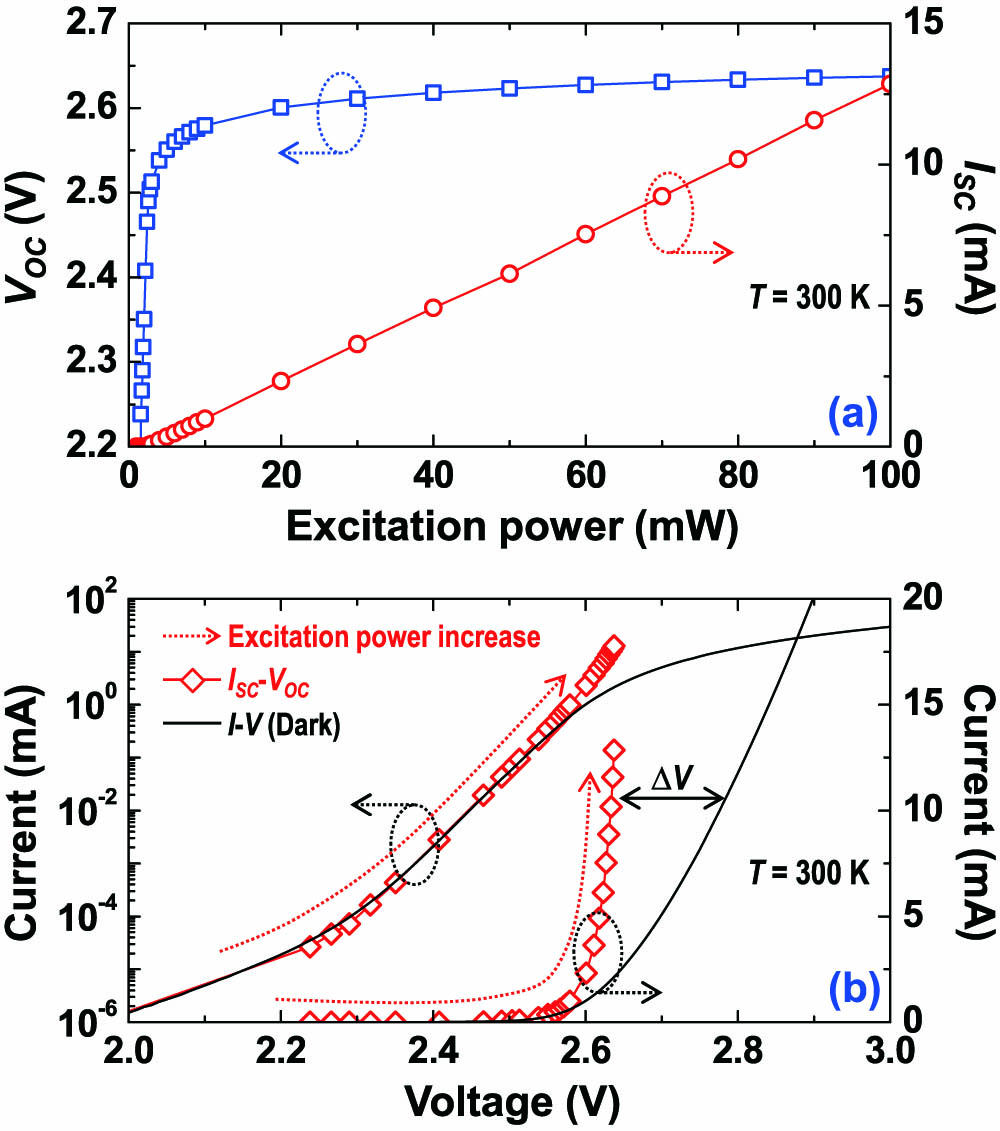
Fig. 2. (a) V OC I SC I SC − V OC I – V
Fig. 3. (a) PDIV curves at 15 K and (b) magnified graph. Squares and circles denote I SC V OC
Fig. 4. (a) V OC I SC I SC − V OC I – V
Fig. 5. Normalized photoluminescence (PL) and electroluminescence (EL) spectra measured at (a) 80 mW, 10.1 mA (2.78 V), and 2.63 V (1.9 mA) at an operating temperature of 300 K and (b) 80 mW, 50 mA (4.23 V), and 1.9 mA (3.89 V) at 15 K, respectively.
Fig. 6. Schematic illustration of the band diagram including the proposed carrier transport and accumulation mechanisms at (a) 300 K and (b) 15 K.
Fig. 7. (a) I V eff 2 α I 0
Fig. 8. η o − e η o − o
Fig. 9. (a) PDIV curves at 15 K and (b) its magnified graph. The graphs are plotted for the same optical excitation power in Fig. 1 (0 to 100 mW, step: 20 mW).
Fig. 10. Normalized PL spectrum measured at 80 mW and EL spectra depending on the injected current (a) at 300 K and (b) 15 K, respectively.
Fig. 11. Normalized EL spectrum measured at 10.1 mA and PL spectra depending on the optical excitation power at 300 K.

Set citation alerts for the article
Please enter your email address
© Copyright 2018-2021 | Chinese Laser Press. All Rights Reserved 沪ICP备15018463号-20