• Infrared and Laser Engineering
  • Vol. 50, Issue 3, 20210010 (2021)
Chao Ban1, Weilin Pan1、2, Rui Wang3, Wentao Huang3, Fuchao Liu4, Zhangjun Wang5, Xin Fang6, Xuewu Cheng7, and Hongqiao Hu3
Author Affiliations
  • 1Key Laboratory of Middle Atmosphere and Global Environment Observation, Institute of Atmospheric Physics, Chinese Academy of Sciences, Beijing 100029, China
  • 2University of Chinese Academy of Sciences, Beijing 100049, China
  • 3Key Laboratory of Polar Science, Ministry of Natural Resources, Polar Research Institute of China, Shanghai 200136, China
  • 4School of Electronic Information, Wuhan University, Wuhan 430072, China
  • 5Institute of Oceanographic Instrumentation, Shandong Academy of Sciences, Qingdao 266100, China
  • 6Key Laboratory of Geospace Environment, Chinese Academy of Sciences, University of Science and Technology of China, Hefei 230026, China
  • 7Innovation Academy for Precision Measurement Science and Technology, Chinese Academy of Sciences, Wuhan 430071, China
  • show less
    DOI: 10.3788/IRLA20210010 Cite this Article
    Chao Ban, Weilin Pan, Rui Wang, Wentao Huang, Fuchao Liu, Zhangjun Wang, Xin Fang, Xuewu Cheng, Hongqiao Hu. Initial results of Rayleigh scattering lidar observations at Zhongshan station, Antarctica[J]. Infrared and Laser Engineering, 2021, 50(3): 20210010 Copy Citation Text show less
    Schematic diagram of Zhongshan station Rayleigh lidar
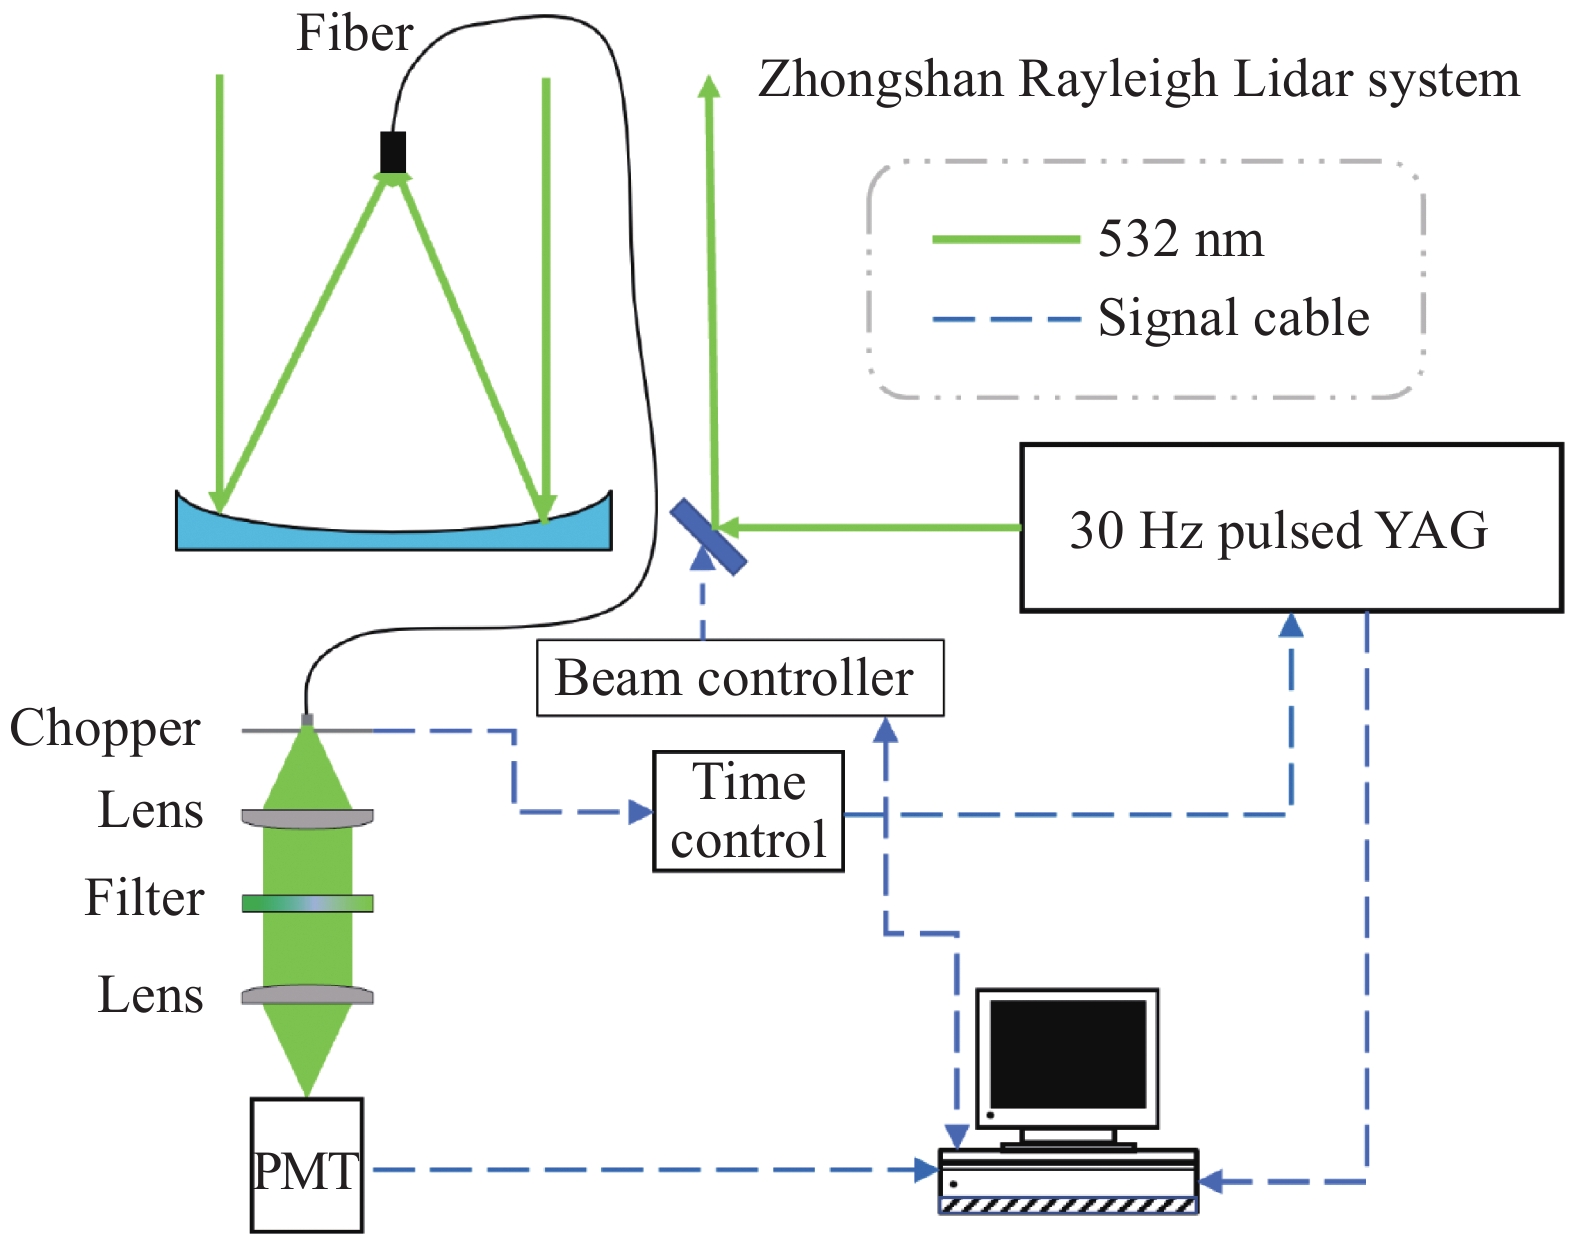
    Fig. 1. Schematic diagram of Zhongshan station Rayleigh lidar
    Rayleigh lidar raw signal profile at night on March 6, 2020, at Zhongshan station. The raw data has a vertical bin width of 30 m and an integration time of 1 min
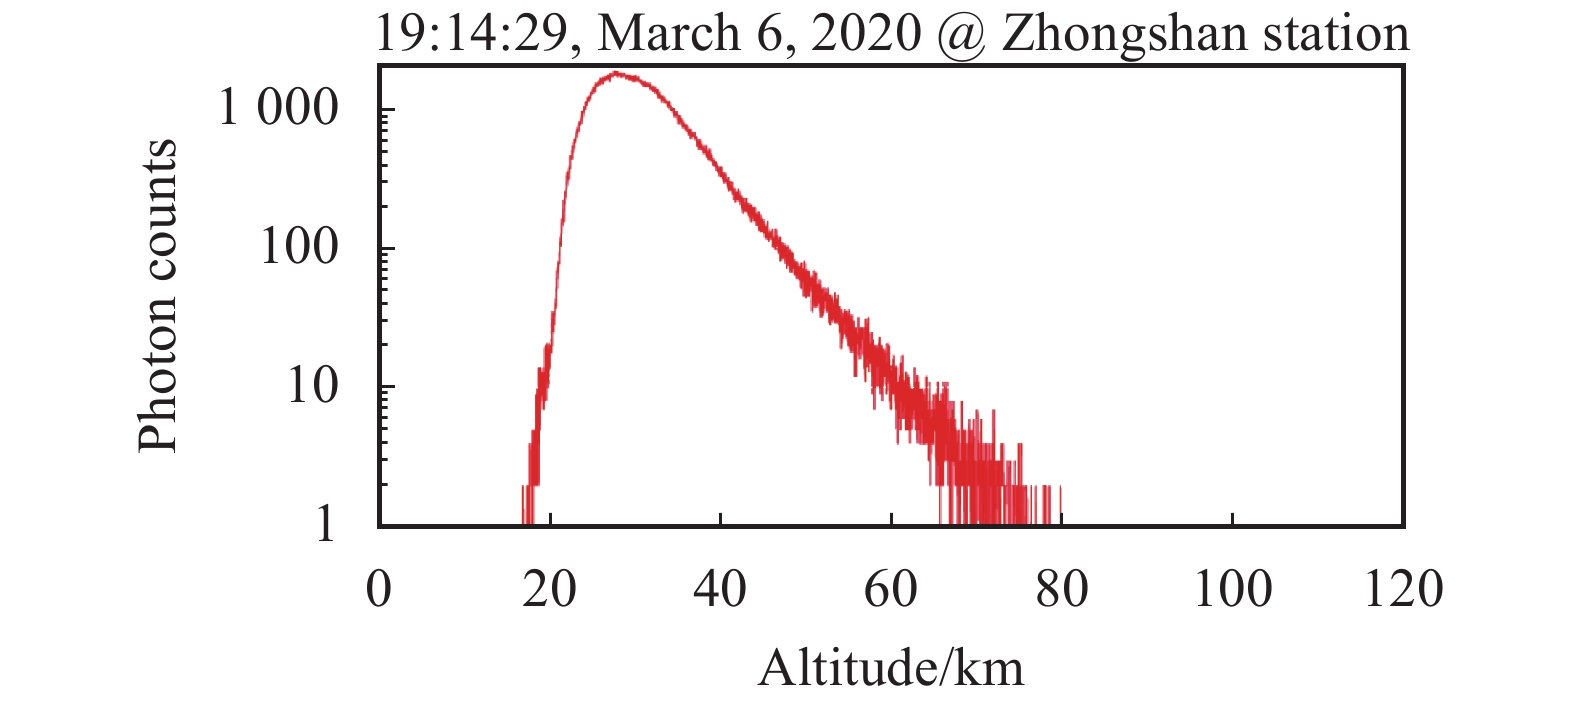
    Fig. 2. Rayleigh lidar raw signal profile at night on March 6, 2020, at Zhongshan station. The raw data has a vertical bin width of 30 m and an integration time of 1 min
    Comparison of atmospheric density (a) and temperature (c) between lidar (red solid), MSIS model (blue dash), and SABER satellite (green dash) data near Zhongshan station on March 6, 2020. The vertical resolution is 300 m and the temporal resolution is 30 min for lidar data. Lidar measured density uncertainty (b) and temperature uncertainty (d) were also plotted
    Fig. 3. Comparison of atmospheric density (a) and temperature (c) between lidar (red solid), MSIS model (blue dash), and SABER satellite (green dash) data near Zhongshan station on March 6, 2020. The vertical resolution is 300 m and the temporal resolution is 30 min for lidar data. Lidar measured density uncertainty (b) and temperature uncertainty (d) were also plotted
    Zhongshan station Rayleigh lidar measured temperature (a), density (b), temperature perturbation (c), and density perturbation (d) on June 30, 2020. The density (b) is plotted in color contour under the logarithm scale
    Fig. 4. Zhongshan station Rayleigh lidar measured temperature (a), density (b), temperature perturbation (c), and density perturbation (d) on June 30, 2020. The density (b) is plotted in color contour under the logarithm scale
    ConfigurationParameters
    Laser transmitterWavelength/nm532
    Pulse energy/mJ400
    Repetition rate/Hz30
    Pulse width/ns8
    Lidar receiverTelescope diameter/m0.8
    Telescope f number 1.8
    Fiber diameter/mm1.5
    Fiber NA0.39
    PMT quantum efficiency~40% @ 532 nm
    Time control & signal acquisitionTime generatorDG645
    Photon counting cardP7882
    Table 1. System configurations of Zhongshan station Rayleigh lidar
    Chao Ban, Weilin Pan, Rui Wang, Wentao Huang, Fuchao Liu, Zhangjun Wang, Xin Fang, Xuewu Cheng, Hongqiao Hu. Initial results of Rayleigh scattering lidar observations at Zhongshan station, Antarctica[J]. Infrared and Laser Engineering, 2021, 50(3): 20210010
    Download Citation