
Minglei Li, Wenpeng Zong, Guangyun Li, Li Wang. Extraction of Structure Line Segments from Point Clouds Using Voxel-Based Region Growing[J]. Acta Optica Sinica, 2018, 38(1): 0112001
- Acta Optica Sinica
- Vol. 38, Issue 1, 0112001 (2018)
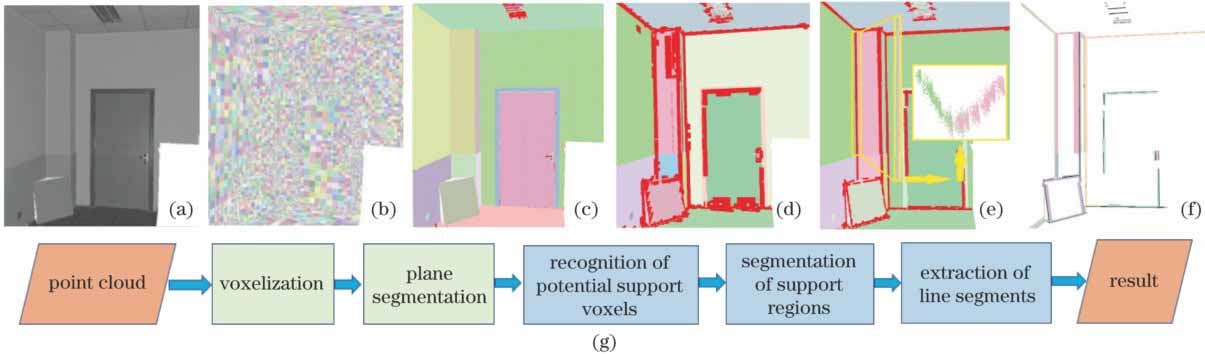
Fig. 1. Procedure of the proposed method. (a) Original point cloud; (b) voxelization; (c) plane segmentation; (d) recognition of potential support voxels; (e) segmentation of support regions; (f) extraction of three-dimensional structure line segments and refinement; (g) algorithm flow chart

Fig. 2. Sketch map for the relationship among intersection angle, voxel size and fitting standard deviation value of two neighbor coplanar voxels
Fig. 3. Recognition of potential support voxels. (a) Global structure of octree voxels; (b) distribution of non-edge and non-edge adjacent voxels which are shown in red; (c) potential support voxels which are shown in red
Fig. 4. Extraction of support regions using voxel-based region growing. (a) Statistics of plane distribution in the neighbor voxels (which are shown in blue) of the seed voxel (which is shown in red) and proceeding of initial region growing (in which the dash lines represent the border of the support region); (b) region growing from the seed voxels (in which the initial seed is in green, the new seeds are in red and the neighbor voxels of the new seeds are in blue, while the red arrows indicate the grow
Fig. 5. Overlap display of fitting plane and original
Fig. 6. Structure line and its support regions. (a) Definition of corresponding parameters of structure line; (b) projection regions of the support regions (yellow region is the final selected support region)
Fig. 7. Refinement of structure line segments. (a) Before refinement; (b) after refinement
Fig. 8. Segmentation result of Data1 (different planes are shown in different color). (a) Data1 and its local feature; (b) segmentation result of OB method; (c) segmentation result of the proposed method
Fig. 9. Extraction results of structure line segments. (a) Data2; (b) Data3; (c) Data4; (d) Data5; (e) extraction result of Data2; (f) extraction result of Data3; (g) extraction result of Data4; (h) extraction result of Data5
Fig. 10. Comparision of structure line segment extracting results of Data4. (a) Original test data; (b) plane segmentation result of RANSAC algorithm; (c) plane segmentation result of the proposed method; (d) extraction result of RPB algorithm; (e) extraction result of VPB algorithm; (f) extraction result of the proposed method (the support regions are hidden for comparision)
|
Table 1. Information of experimental data
|
Table 2. Comparison of experimental results of planer segmentation
|
Table 3. Processing results of experimental data
| ||||||||||||||||||||||||||||||||||||||||||||||||||||||||||
Table 4. Efficiency and accuracy comparison of the algorithms

Set citation alerts for the article
Please enter your email address
© Copyright 2018-2021 | Chinese Laser Press. All Rights Reserved 沪ICP备15018463号-20