
Yan Cheng, Xuelian Yu, Weixian Qian, Ye Qian. Ship wake extraction and detection from infrared remote sensing images[J]. Infrared and Laser Engineering, 2022, 51(2): 20210844
- Infrared and Laser Engineering
- Vol. 51, Issue 2, 20210844 (2022)
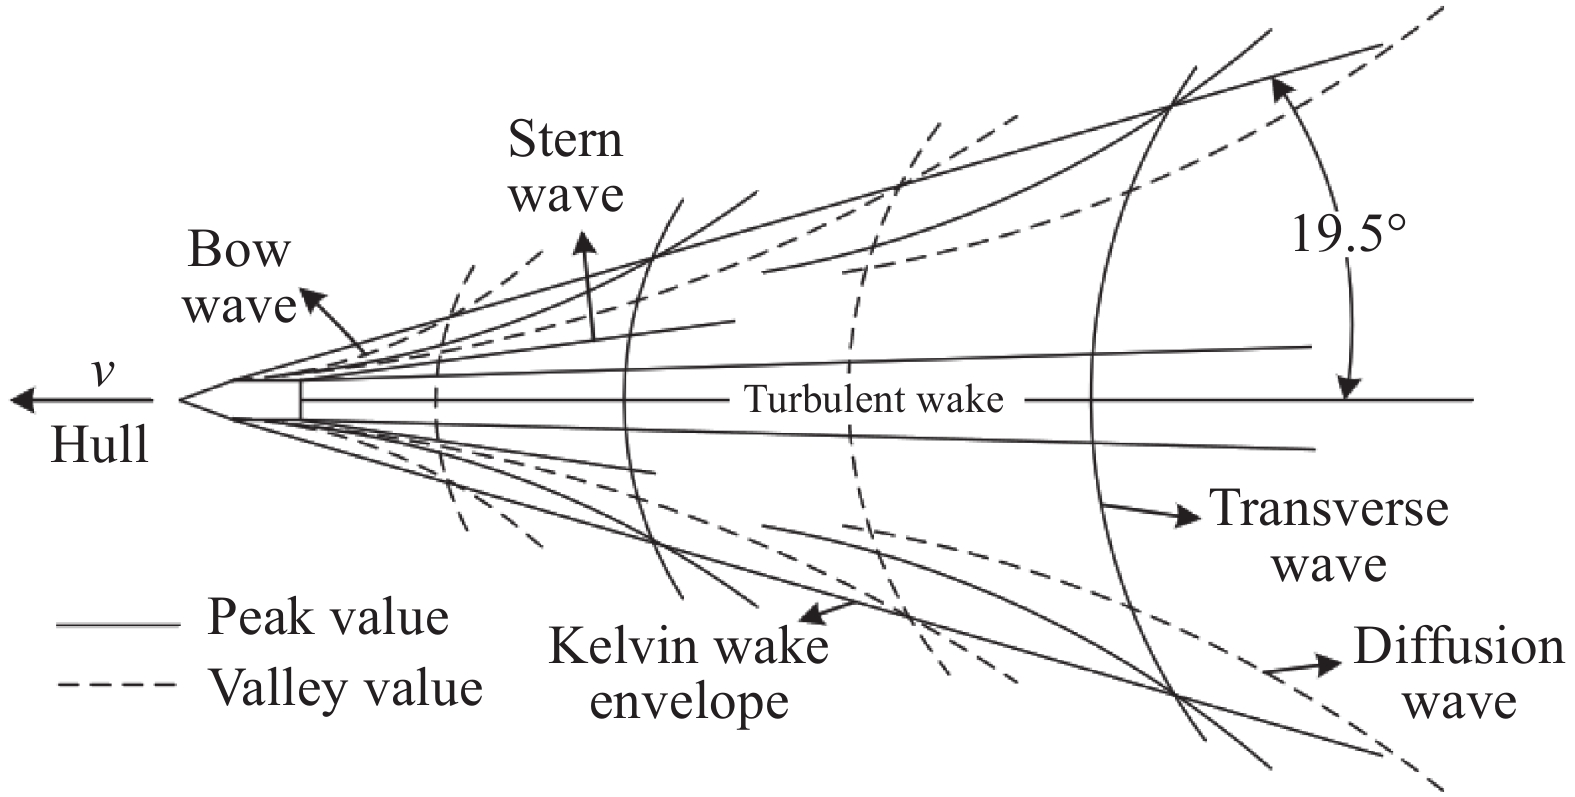
Fig. 1. Ship wake pattern
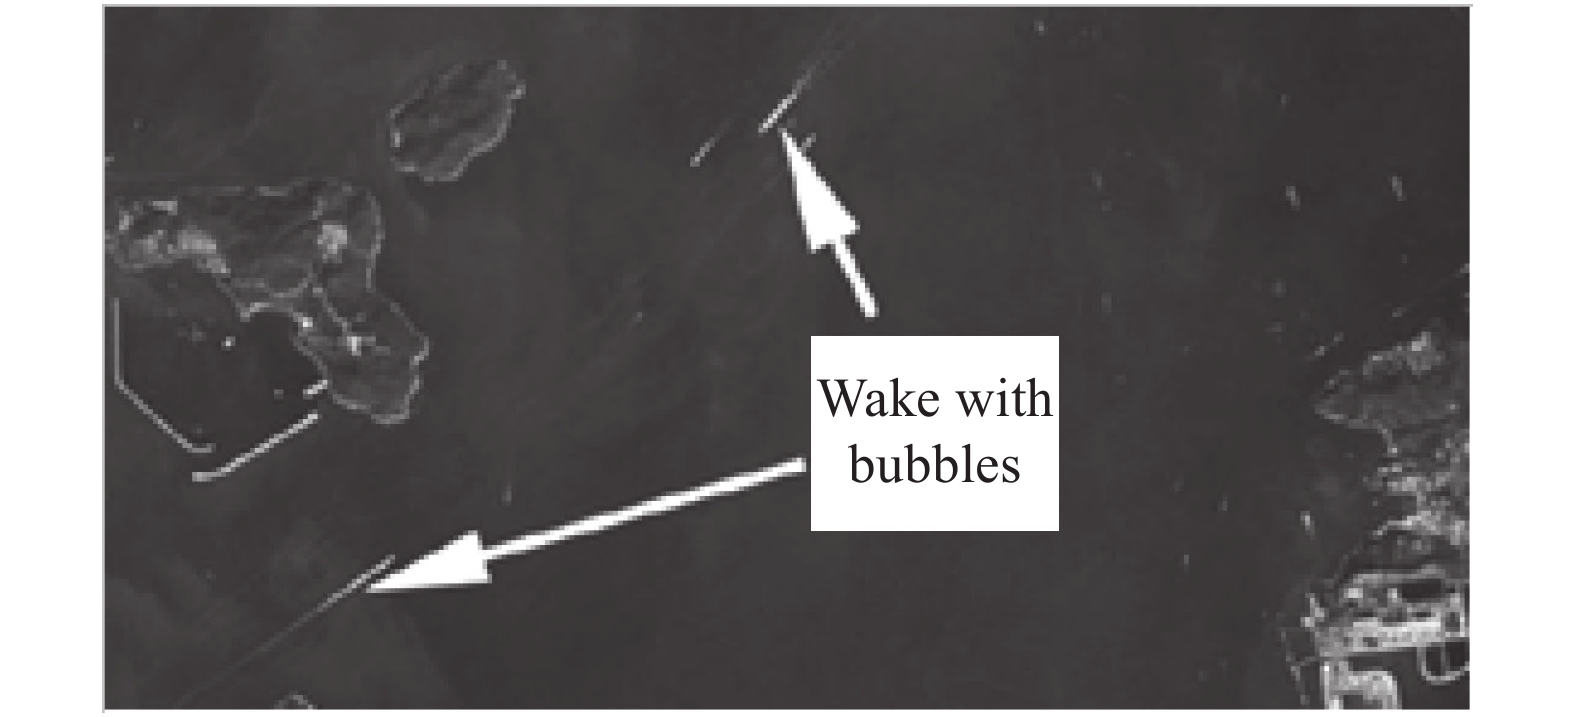
Fig. 2. Optical remote sensing image of ship wake with bubbles
Fig. 3. Sketch of Dot and Curve
Fig. 4. Wake detection and feature extraction algorithm
Fig. 5. Bright wake original image and test results
Fig. 6. Grayscale curve of main and auxiliary axes of bright wake
Fig. 7. Dark wake original image and test results
Fig. 8. Grayscale curve of main and auxiliary axes of dark wake
Fig. 9. Flow chart of ship wake detection and identification algorithm on the sea
Fig. 10. Results of ship wake detection. (a), (d), (g), (j), (m) Original image; (b), (e), (h), (k), (n) Dot-Curve image; (c), (f), (i), (l), (o) Detection result
|
Table 1. Statistics of characteristics of main and auxiliary axes of bright wake
|
Table 2. Statistics of characteristics of main and auxiliary axes of dark wake
|
Table 3. Efficiency of ship wake detection

Set citation alerts for the article
Please enter your email address
© Copyright 2018-2021 | Chinese Laser Press. All Rights Reserved 沪ICP备15018463号-20