• Photonics Research
  • Vol. 8, Issue 12, 1857 (2020)
Yangyang Liang1, Tao Li1、2、3、*, Wenchao Qiao2, Tianli Feng2、6, Shengzhi Zhao2, Yuefeng Zhao3、4, Yuzhi Song3、4, and Christian Kränkel5
Author Affiliations
  • 1China Key Laboratory of Laser & Infrared System (Shandong University), Ministry of Education, Qingdao 266237, China
  • 2School of Information Science and Engineering, and Shandong Provincial Key Laboratory of Laser Technology and Application, Shandong University, Qingdao 266237, China
  • 3Collaborative Innovation Center of Light Manipulations and Applications, Shandong Normal University, Jinan 250358, China
  • 4School of Physics and Electronics, Shandong Normal University, Jinan 250358, China
  • 5Leibniz-Institut für Kristallzüchtung, 12489 Berlin, Germany
  • 6e-mail: tlfeng@sdu.edu.cn
  • show less
    DOI: 10.1364/PRJ.401168 Cite this Article Set citation alerts
    Yangyang Liang, Tao Li, Wenchao Qiao, Tianli Feng, Shengzhi Zhao, Yuefeng Zhao, Yuzhi Song, Christian Kränkel. Mid-infrared Q-switch performance of ZrC[J]. Photonics Research, 2020, 8(12): 1857 Copy Citation Text show less
    (a) Scheme of the face-centered cubic ZrC unit cell, (b) calculated band structure of ZrC, (c) projected DOS for ZrC, and (d) XRD pattern of ZrC powder.
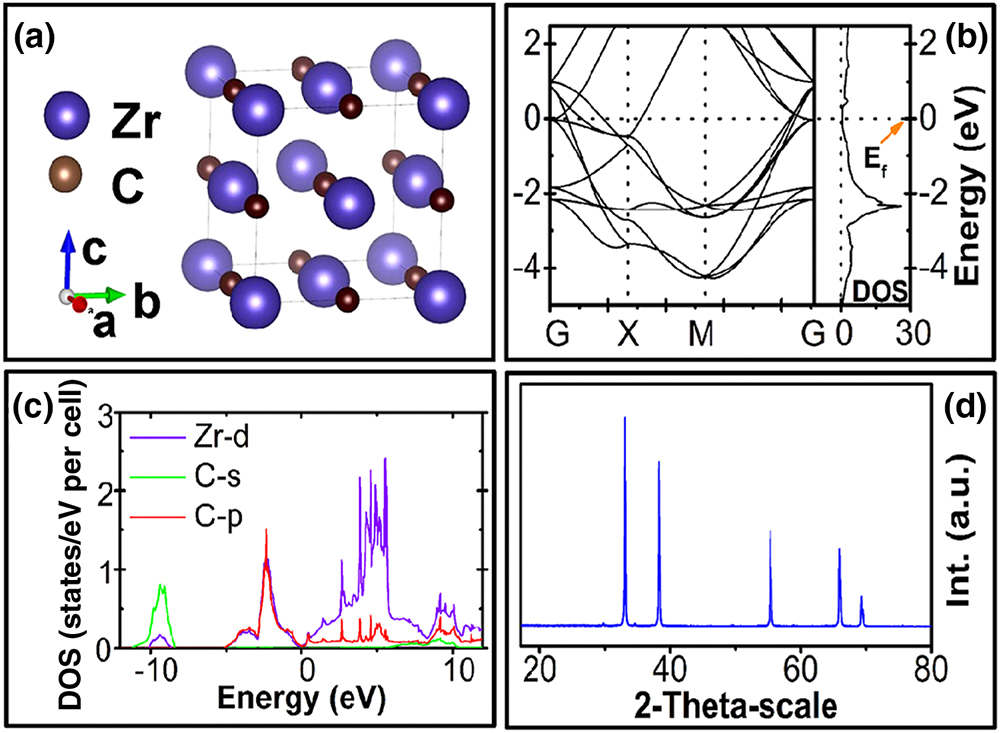
    Fig. 1. (a) Scheme of the face-centered cubic ZrC unit cell, (b) calculated band structure of ZrC, (c) projected DOS for ZrC, and (d) XRD pattern of ZrC powder.
    (a) SEM image and (b) TEM image of sonicated ZrC solvent; (c) TEM image, (d) AFM image, and (e) height variations in the region marked in blue in (d) of ZrC nanoflakes; (f) TEM image of a ZrC cluster.
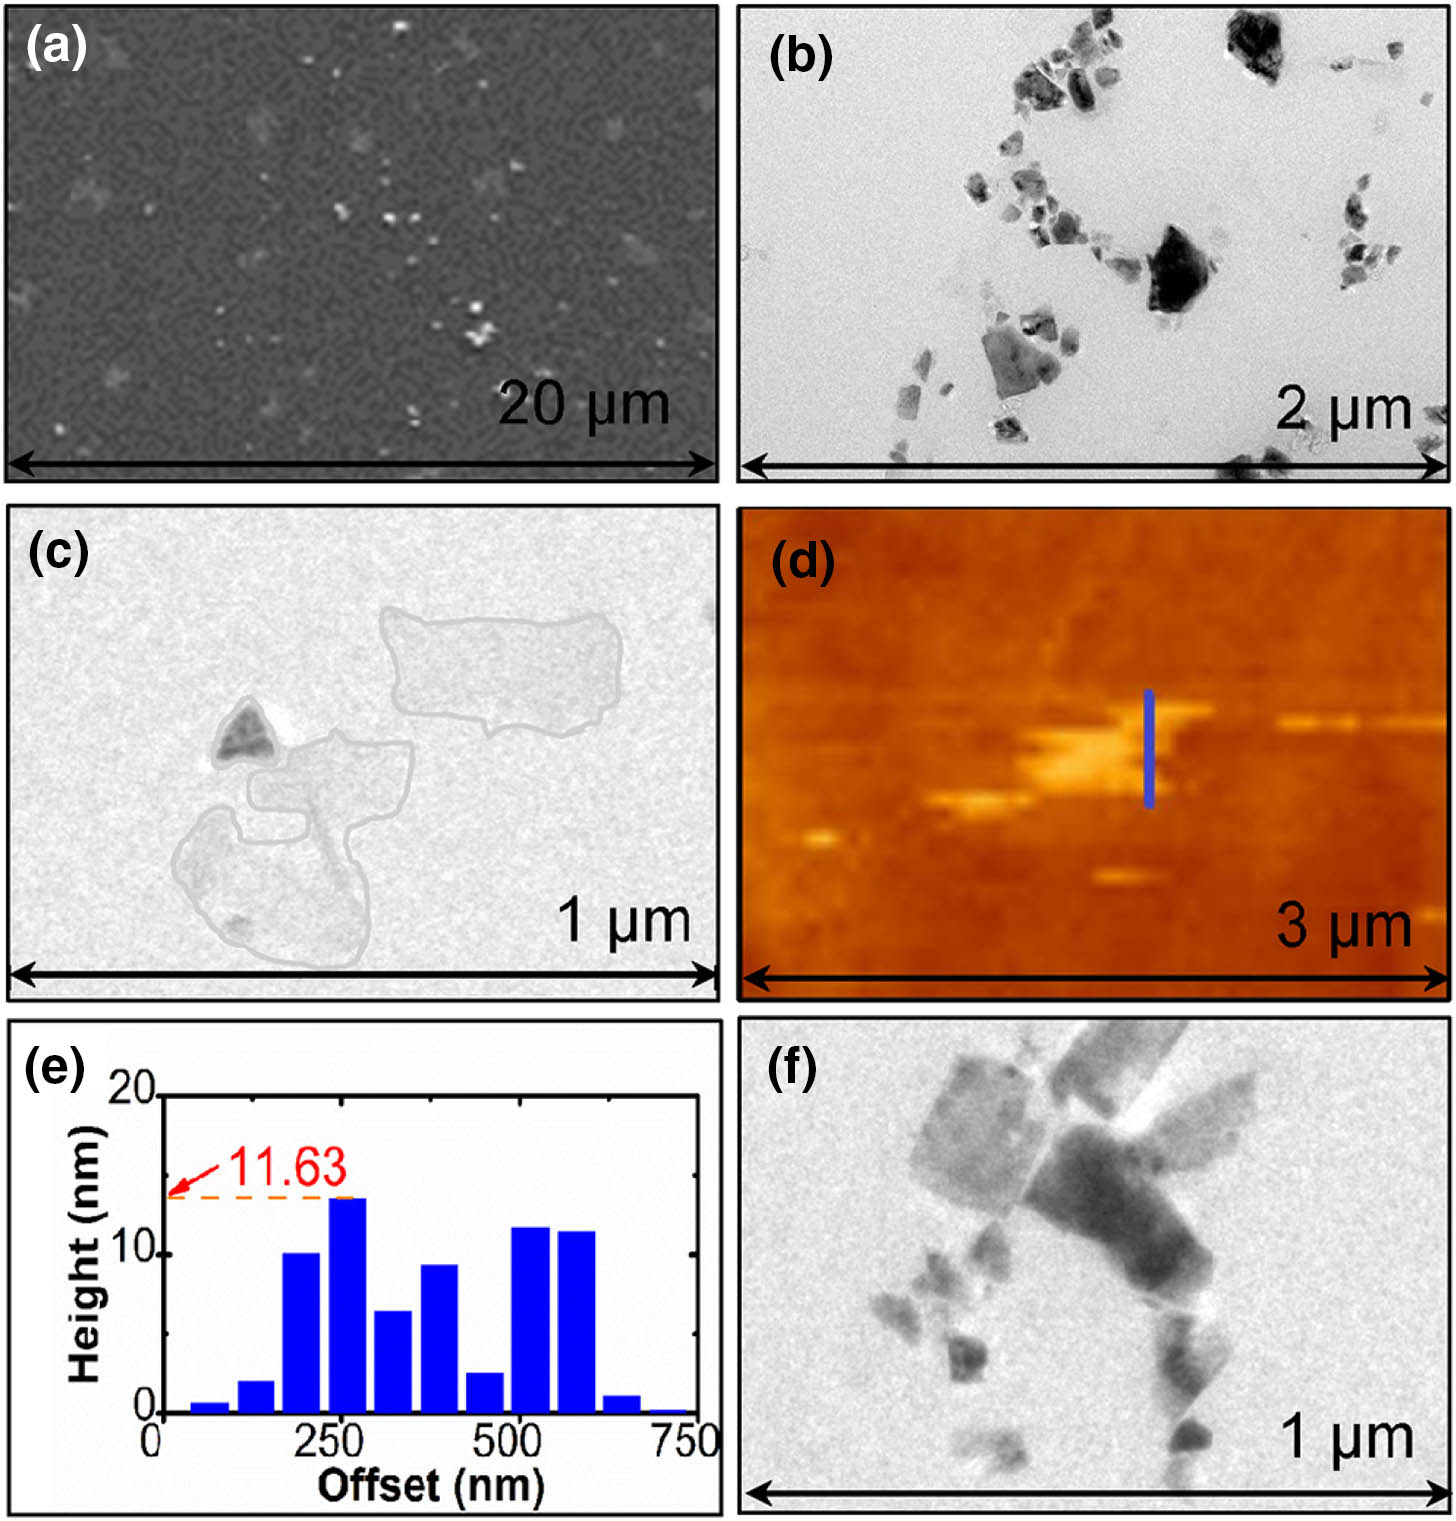
    Fig. 2. (a) SEM image and (b) TEM image of sonicated ZrC solvent; (c) TEM image, (d) AFM image, and (e) height variations in the region marked in blue in (d) of ZrC nanoflakes; (f) TEM image of a ZrC cluster.
    Top: linear transmission of (a) ZrC nanoflake SA and (b) ZrC nanocluster SA, nonlinear transmission of (c) ZrC nanoflake SA and (d) ZrC nanocluster SA; bottom: laser configuration scheme.
    Fig. 3. Top: linear transmission of (a) ZrC nanoflake SA and (b) ZrC nanocluster SA, nonlinear transmission of (c) ZrC nanoflake SA and (d) ZrC nanocluster SA; bottom: laser configuration scheme.
    (a) Output power versus pump power of the CW laser (inset: CW lasing spectrum); (b) output power (inset: lasing spectrum), (c) repetition rate, (d) pulse energy, (e) pulse duration, and (f) peak power versus absorbed pump power for the ZrC nanoflakes SA Q-switched laser.
    Fig. 4. (a) Output power versus pump power of the CW laser (inset: CW lasing spectrum); (b) output power (inset: lasing spectrum), (c) repetition rate, (d) pulse energy, (e) pulse duration, and (f) peak power versus absorbed pump power for the ZrC nanoflakes SA Q-switched laser.
    Top: (a) output stability of the nanocluster SA Q-switched laser operation (inset: image of damaged IC) as well as (b) output power, (c) repetition rate, (d) pulse energy, (e) pulse duration, and (f) peak power versus absorbed pump power; bottom: typical Q-switched pulse train and temporal pulse shape at the maximum average output power.
    Fig. 5. Top: (a) output stability of the nanocluster SA Q-switched laser operation (inset: image of damaged IC) as well as (b) output power, (c) repetition rate, (d) pulse energy, (e) pulse duration, and (f) peak power versus absorbed pump power; bottom: typical Q-switched pulse train and temporal pulse shape at the maximum average output power.
    Yangyang Liang, Tao Li, Wenchao Qiao, Tianli Feng, Shengzhi Zhao, Yuefeng Zhao, Yuzhi Song, Christian Kränkel. Mid-infrared Q-switch performance of ZrC[J]. Photonics Research, 2020, 8(12): 1857
    Download Citation