• Acta Optica Sinica
  • Vol. 41, Issue 17, 1724001 (2021)
Chang Wang1、2, Xue Wang1、2, Xuqing Sun1, Ruxue Wei1、2, Hongyao Liu1, Xiaojuan Sun1、2, Fei Wang1、2, Xinchao Lu1、*, and Chengjun Huang1、2
Author Affiliations
  • 1Health Electronics Center, Institute of Microelectronics of Chinese Academy of Sciences, Beijing 100029, China
  • 2University of Chinese Academy of Sciences, Beijing 100049, China
  • show less
    DOI: 10.3788/AOS202141.1724001 Cite this Article Set citation alerts
    Chang Wang, Xue Wang, Xuqing Sun, Ruxue Wei, Hongyao Liu, Xiaojuan Sun, Fei Wang, Xinchao Lu, Chengjun Huang. Objective-Coupled Wavelength and Angle Co-Modulated Surface Plasmon Resonance Sensor[J]. Acta Optica Sinica, 2021, 41(17): 1724001 Copy Citation Text show less
    Schematic diagram of SP excitation by objective-coupled Kretschmann configuration
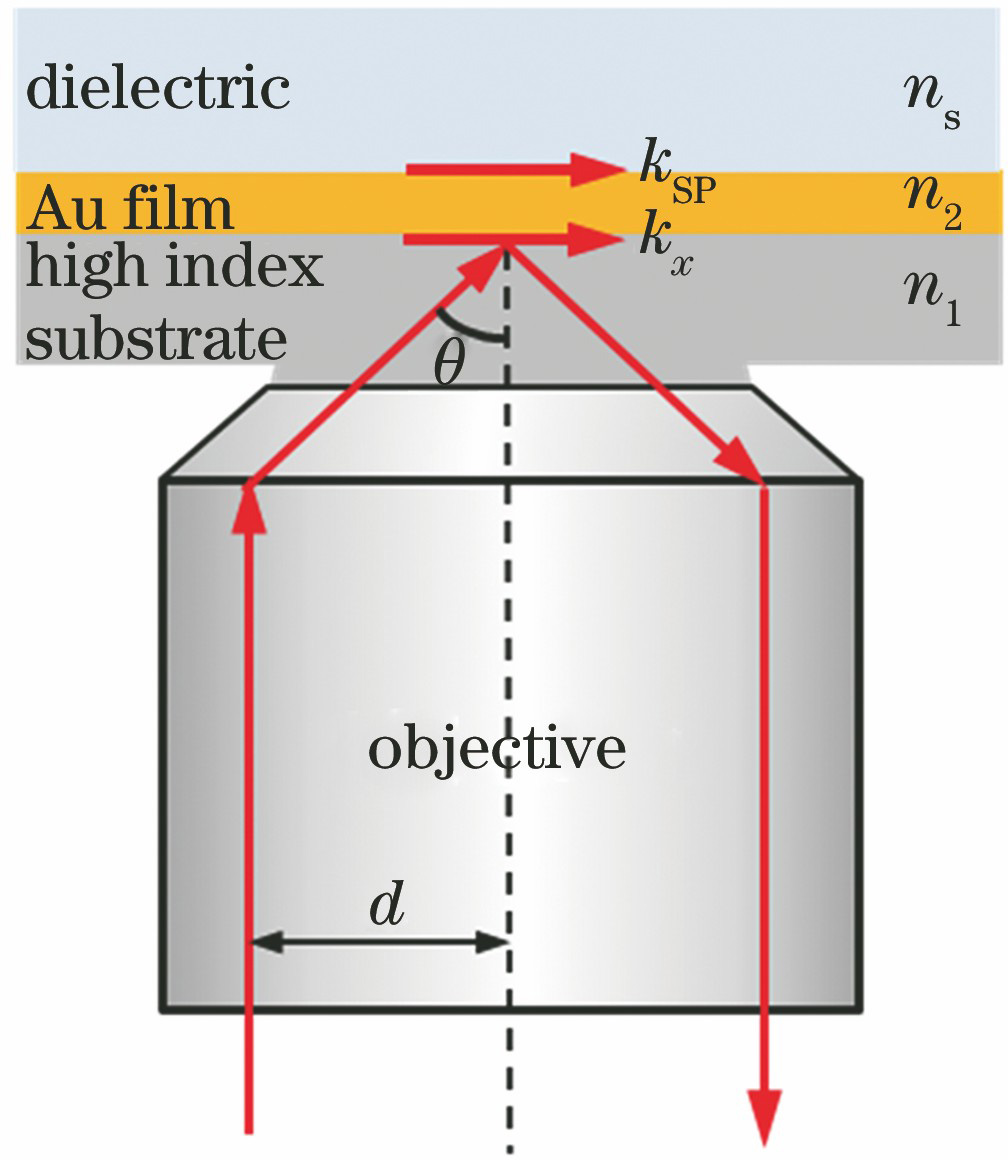
    Fig. 1. Schematic diagram of SP excitation by objective-coupled Kretschmann configuration
    Simulated relationship curves between refractive index and SPR wavelength when changing excitation angles. (a) SPR reflectance spectra of different dielectric refractive index for excitation angle of 54.2524°; (b) relationship between resonance wavelength and refractive index of dielectric under different excitation angles (fitting line represents the maximum sensitivity and detection range); (c) normalized reflectance varying with angle under different resonance wavelengths and refractive indexes
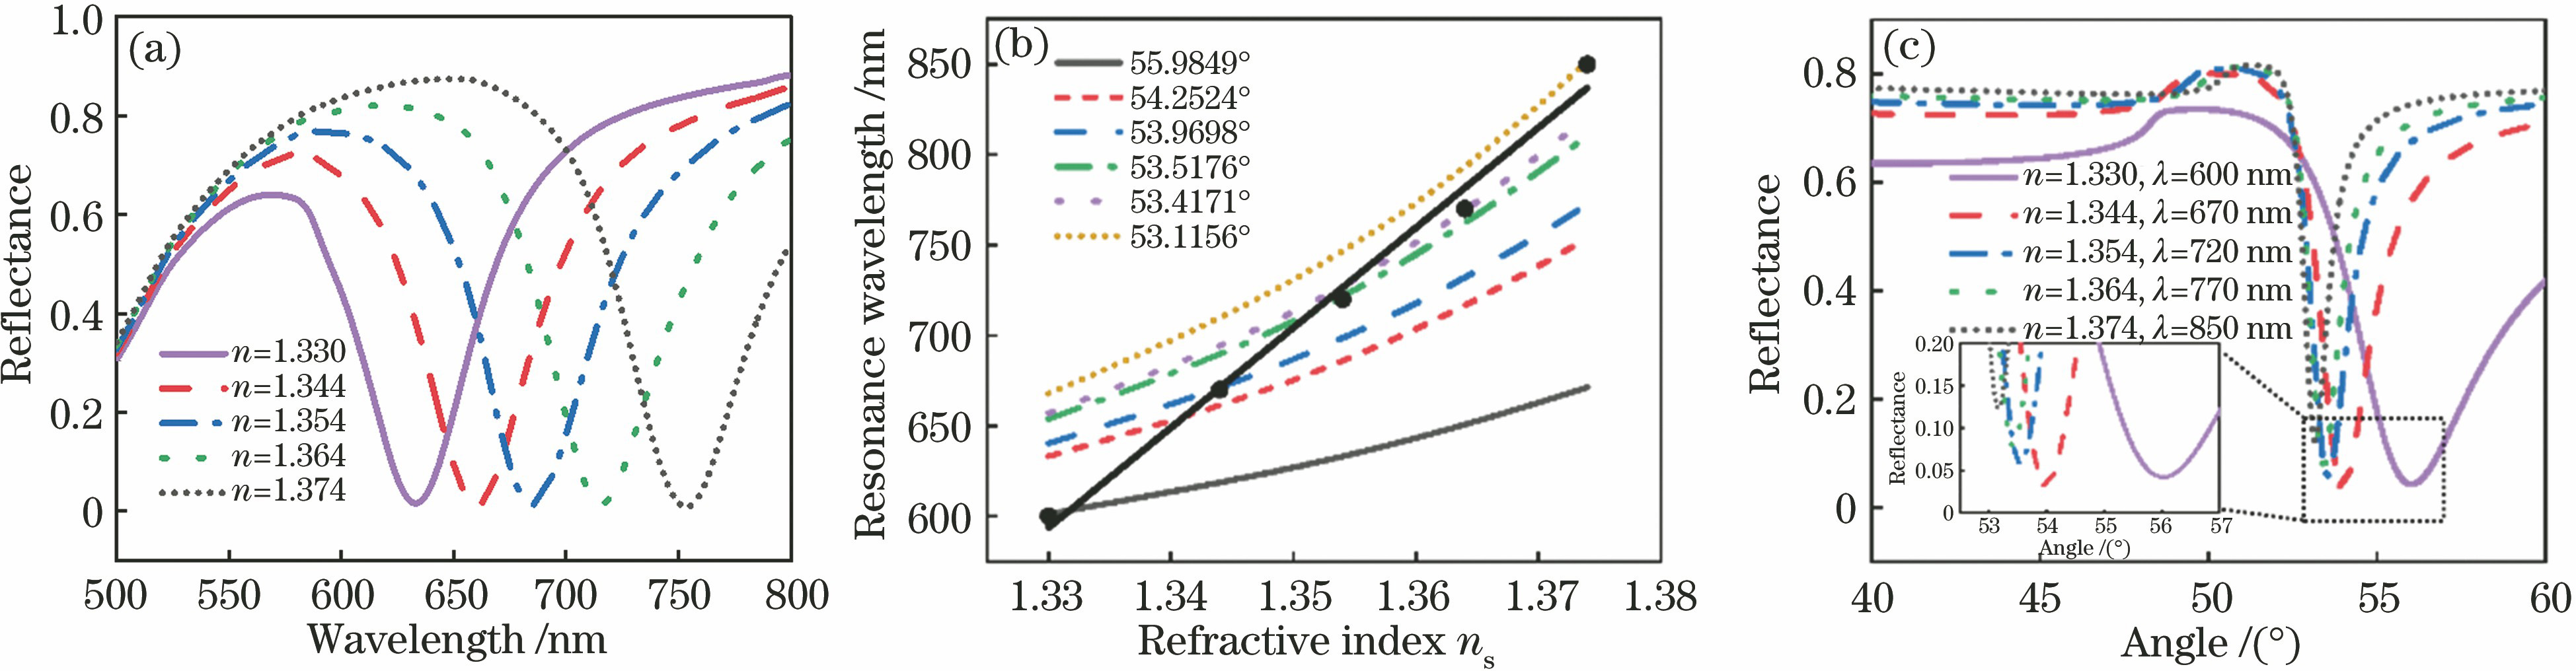
    Fig. 2. Simulated relationship curves between refractive index and SPR wavelength when changing excitation angles. (a) SPR reflectance spectra of different dielectric refractive index for excitation angle of 54.2524°; (b) relationship between resonance wavelength and refractive index of dielectric under different excitation angles (fitting line represents the maximum sensitivity and detection range); (c) normalized reflectance varying with angle under different resonance wavelengths and refractive indexes
    Diagram of optical path and spectrum of white light source within the range of 500-850 nm. (a) Experimental setup of wavelength and angle co-modulated SPR sensor; (b) spectrum of white light source within the range of 500-850 nm
    Fig. 3. Diagram of optical path and spectrum of white light source within the range of 500-850 nm. (a) Experimental setup of wavelength and angle co-modulated SPR sensor; (b) spectrum of white light source within the range of 500-850 nm
    Relationship between excitation angle and resonance wavelength. (a) SPR reflectance spectra for different excitation angles when dielectric is air; (b) curve of resonance wavelength varying with excitation angle (the solid curve represents the binomial fitting)
    Fig. 4. Relationship between excitation angle and resonance wavelength. (a) SPR reflectance spectra for different excitation angles when dielectric is air; (b) curve of resonance wavelength varying with excitation angle (the solid curve represents the binomial fitting)
    Relationship between refractive index and resonance wavelength with fixed excitation angle. (a) SPR reflectance spectra of glucose solutions with different concentrations for fixed excitation angle of 55.25°; (b) curve of resonance wavelength varying with refractive index (the solid line represents the linear fitting result)
    Fig. 5. Relationship between refractive index and resonance wavelength with fixed excitation angle. (a) SPR reflectance spectra of glucose solutions with different concentrations for fixed excitation angle of 55.25°; (b) curve of resonance wavelength varying with refractive index (the solid line represents the linear fitting result)
    Relationship between refractive index and resonance wavelength with wavelength and angle co-modulation. (a) SPR reflectance spectra of glucose solutions with different concentrations for different excitation angles; (b) curve of resonance wavelength varying with refractive index under different excitation angles (the solid line represents the linear fitting result)
    Fig. 6. Relationship between refractive index and resonance wavelength with wavelength and angle co-modulation. (a) SPR reflectance spectra of glucose solutions with different concentrations for different excitation angles; (b) curve of resonance wavelength varying with refractive index under different excitation angles (the solid line represents the linear fitting result)
    Refractive indexExcitation angle /(°)Resonance wavelength /nm
    1.33055.9849600
    1.34453.9698670
    1.35453.5176720
    1.36453.4171770
    1.37453.1156850
    Table 1. Relationship among refractive index, excitation angle, and resonance wavelength under maximal detection sensitivity
    Chang Wang, Xue Wang, Xuqing Sun, Ruxue Wei, Hongyao Liu, Xiaojuan Sun, Fei Wang, Xinchao Lu, Chengjun Huang. Objective-Coupled Wavelength and Angle Co-Modulated Surface Plasmon Resonance Sensor[J]. Acta Optica Sinica, 2021, 41(17): 1724001
    Download Citation