• Photonics Research
  • Vol. 8, Issue 12, B47 (2020)
Weijie Wu1、2, Shizhen Chen1, Wenhao Xu1, Zhenxing Liu3, Runnan Lou2, Lihua Shen2, Hailu Luo1、4、*, Shuangchun Wen1, and Xiaobo Yin2、3、5、*
Author Affiliations
  • 1Laboratory for Spin Photonics, School of Physics and Electronics, Hunan University, Changsha 410082, China
  • 2Department of Mechanical Engineering, University of Colorado, Boulder, Colorado 80309, USA
  • 3Materials Science and Engineering Program, University of Colorado, Boulder, Colorado 80309, USA
  • 4e-mail: hailuluo@hnu.edu.cn
  • 5e-mail: xiaobo.yin@colorado.edu
  • show less
    DOI: 10.1364/PRJ.401531 Cite this Article Set citation alerts
    Weijie Wu, Shizhen Chen, Wenhao Xu, Zhenxing Liu, Runnan Lou, Lihua Shen, Hailu Luo, Shuangchun Wen, Xiaobo Yin. Weak-value amplification for the optical signature of topological phase transitions[J]. Photonics Research, 2020, 8(12): B47 Copy Citation Text show less
    Schematic representation of the wave reflection from an air–silicene interface. The system is subject to a static electric field Ez, which is opposite the z axis, and to circularly polarized lasers. The lattice constant is a=3.86 Å, staggering length value is ℓ=0.23 Å, and the effective spin-orbit coupling is λSO=3.9 meV.
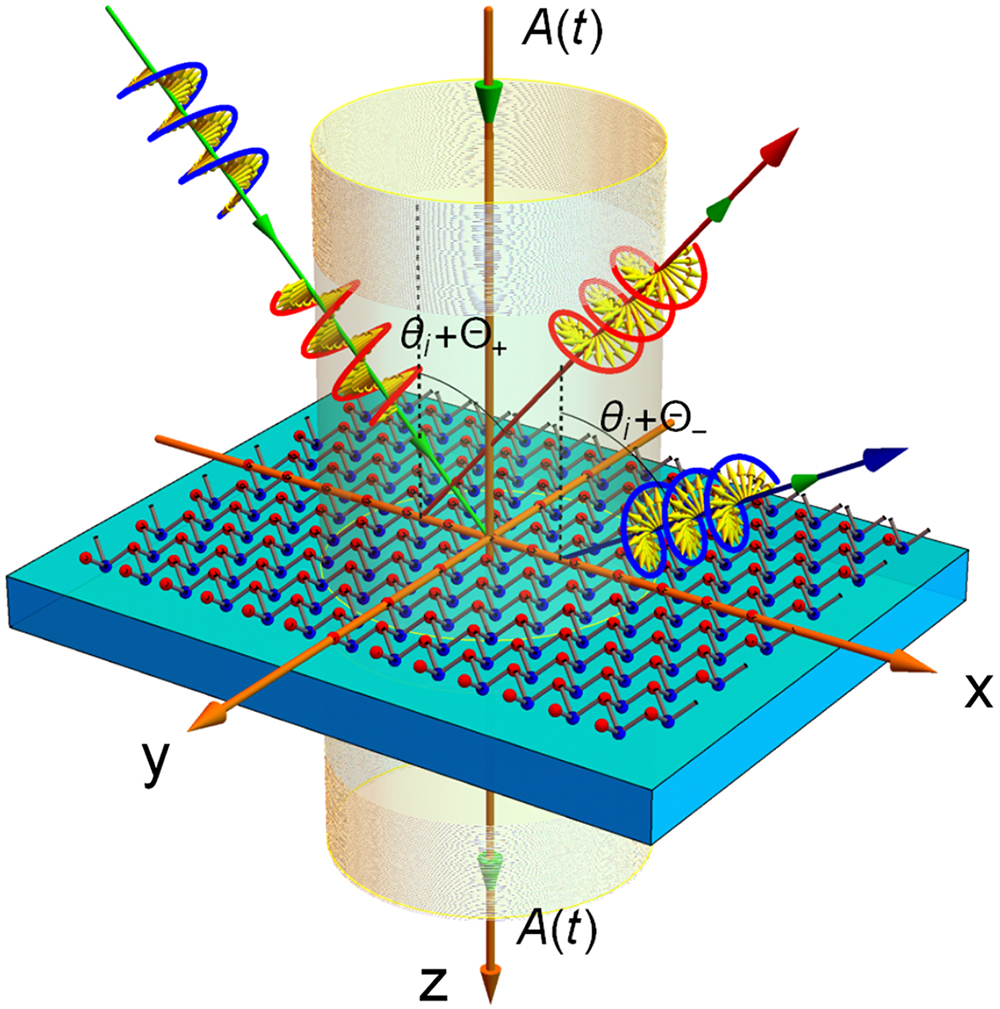
    Fig. 1. Schematic representation of the wave reflection from an air–silicene interface. The system is subject to a static electric field Ez, which is opposite the z axis, and to circularly polarized lasers. The lattice constant is a=3.86  , staggering length value is =0.23  , and the effective spin-orbit coupling is λSO=3.9  meV.
    Electronic band structure of silicene for K and K′ point in the states of (a) QSHI, (b) SPM, (c) QAHI, (d) SVPM, (e) PS-QHI, (f) BI, and (g) SDC. The red arrow (blue arrow) is for up-spin (down-spin) electrons. (h) Berry curvature F(k→) can distinguish the topological insulator and trivial insulator.
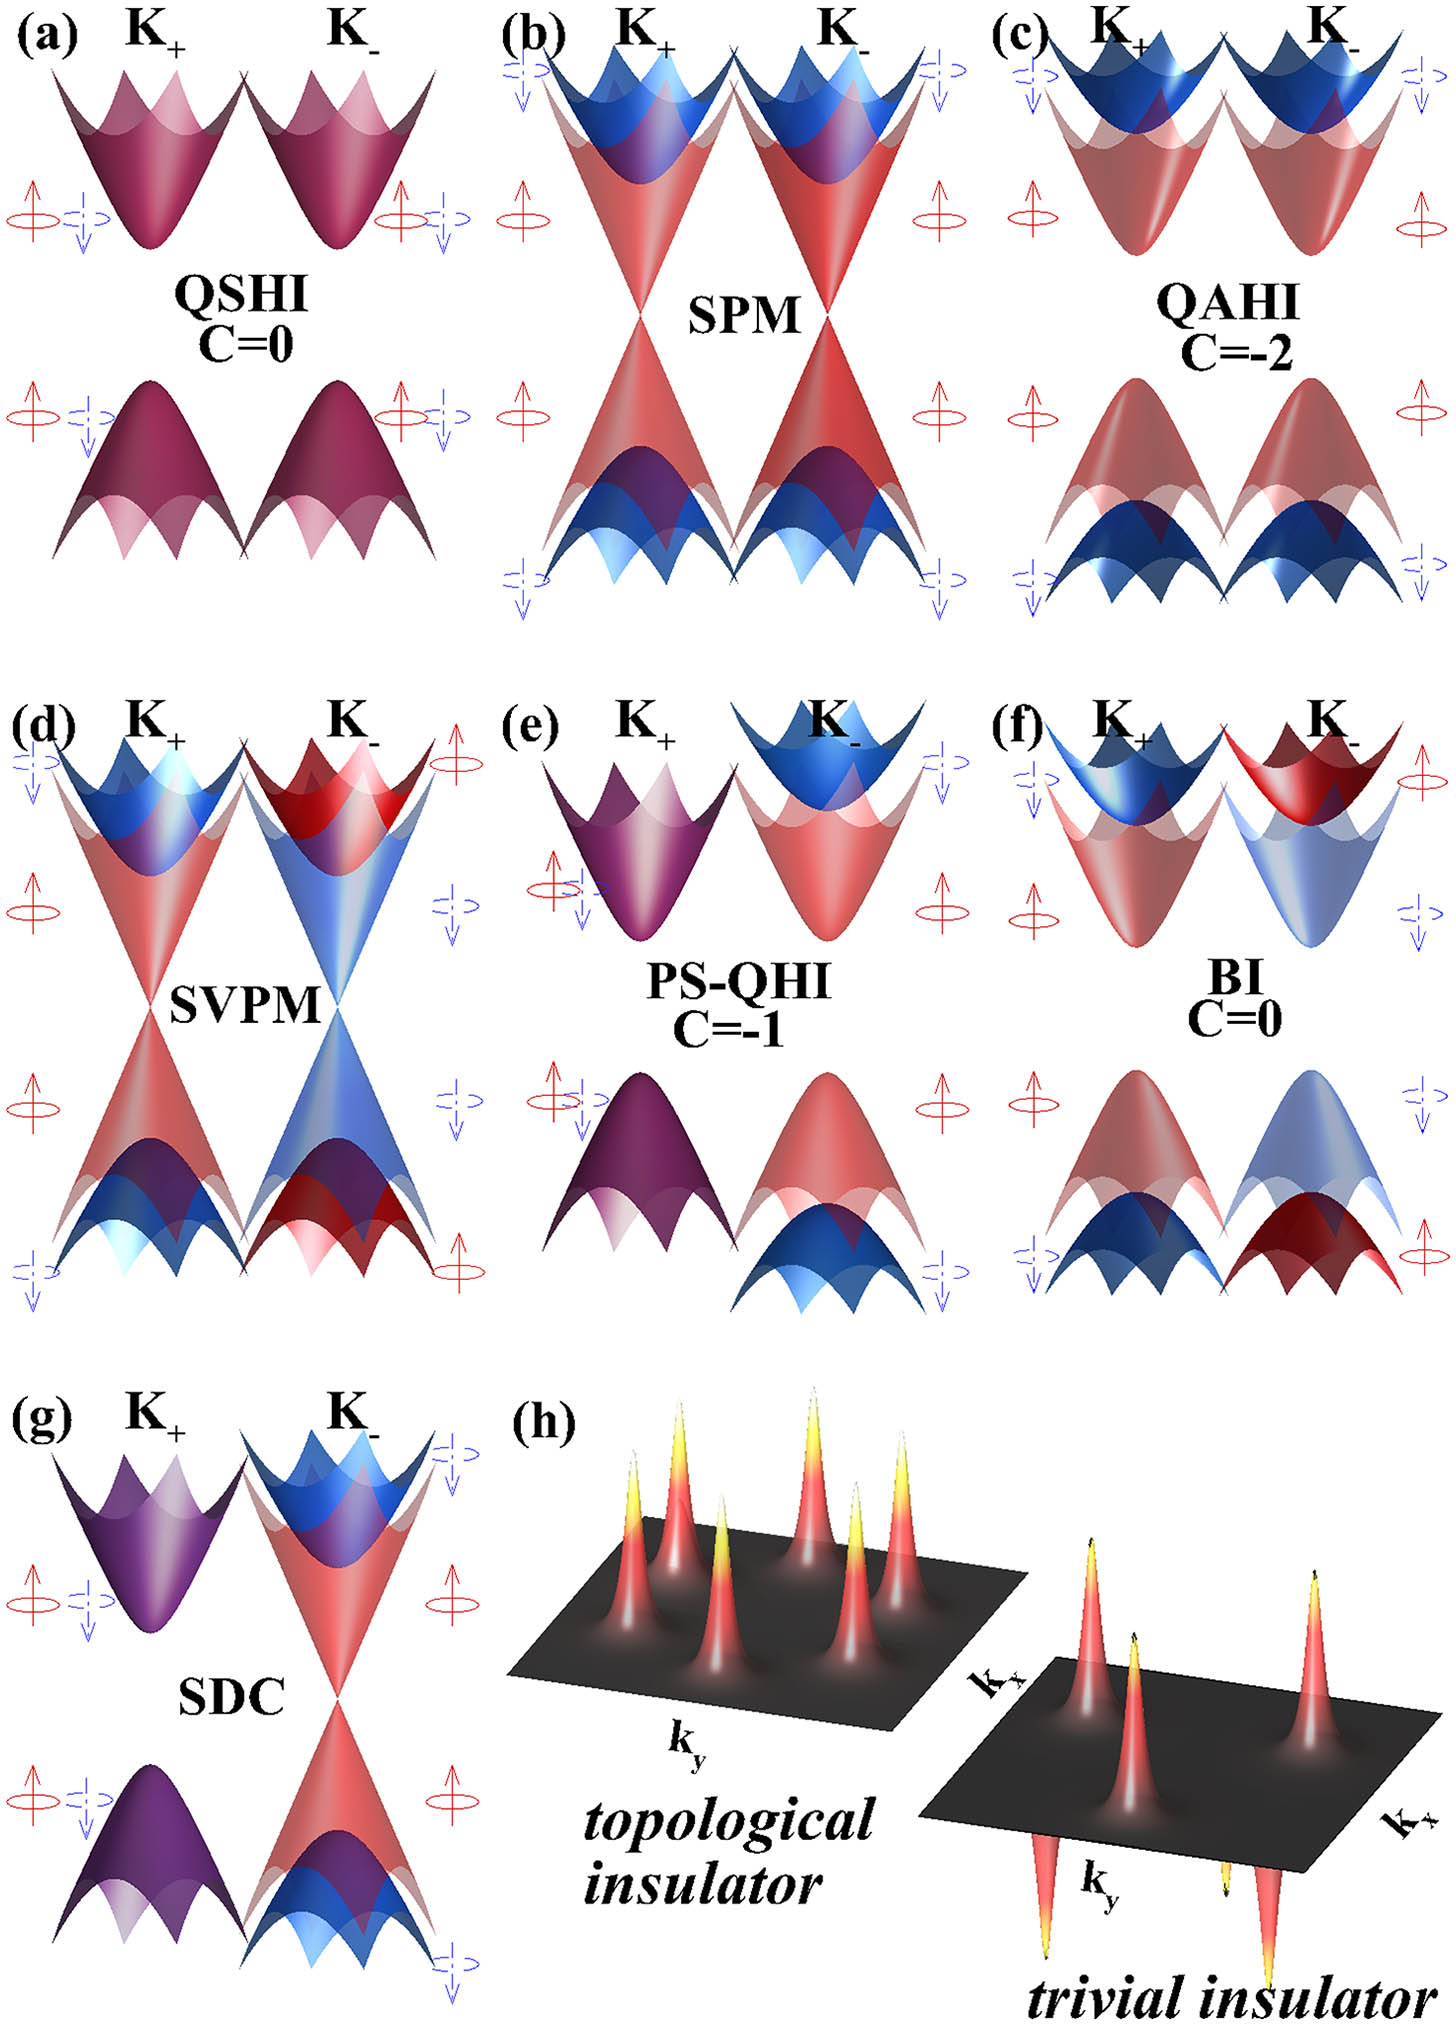
    Fig. 2. Electronic band structure of silicene for K and K point in the states of (a) QSHI, (b) SPM, (c) QAHI, (d) SVPM, (e) PS-QHI, (f) BI, and (g) SDC. The red arrow (blue arrow) is for up-spin (down-spin) electrons. (h) Berry curvature F(k) can distinguish the topological insulator and trivial insulator.
    Phase diagrams of (a) right- and (b) left-circular photonic Hall spatial shifts are given in the (elEz,Λ)/λSO plane, and the Chern number C is indicated. The (c) right- and (d) left-circular photonic Hall angular deviations are described in the topological phase diagram. The lines outline the phase boundaries indexed by Kη. The solid line represents the s=↑, and the dashed line represents the s=↓. The wavelength is 810 nm.
    Fig. 3. Phase diagrams of (a) right- and (b) left-circular photonic Hall spatial shifts are given in the (elEz,Λ)/λSO plane, and the Chern number C is indicated. The (c) right- and (d) left-circular photonic Hall angular deviations are described in the topological phase diagram. The lines outline the phase boundaries indexed by Kη. The solid line represents the s=, and the dashed line represents the s=. The wavelength is 810 nm.
    Representation on the Bloch sphere of the preselection |ψi⟩ and postselection |ψf⟩ states. A middle state |ψm⟩ is considered due to the polarized rotation effect. The angle Δ1(Δ2) gives the origin to the real (imaginary) parts of the weak value.
    Fig. 4. Representation on the Bloch sphere of the preselection |ψi and postselection |ψf states. A middle state |ψm is considered due to the polarized rotation effect. The angle Δ1(Δ2) gives the origin to the real (imaginary) parts of the weak value.
    The optical signature is amplified by the quantum weak measurement technique. The (a) spatial and (b) angular photonic spin Hall shifts as a function of the postselected angles. Furthermore, the Δ1 and Δ2 correspond to the small changes in longitude and latitude on the Bloch sphere, respectively.
    Fig. 5. The optical signature is amplified by the quantum weak measurement technique. The (a) spatial and (b) angular photonic spin Hall shifts as a function of the postselected angles. Furthermore, the Δ1 and Δ2 correspond to the small changes in longitude and latitude on the Bloch sphere, respectively.
    Comparisons between an unperturbed and postselected intensity I distribution in different states. The intensity distribution and shifts of field centroid in the state of (a) QSHI, (b) SPM, and (c) QAHI. (d)–(f) Signal amplified by weak measurement technique. The real (solid) and imaginary (dashed) parts of the Hall conductivity are depicted in (g). (h) The original signal and (i) the amplified signal as a function of photon energy. The parameters are Λ/λSO=0 (QSHI), 1 (SPM), and 2 (QAHI). elEz/λSO=0.
    Fig. 6. Comparisons between an unperturbed and postselected intensity I distribution in different states. The intensity distribution and shifts of field centroid in the state of (a) QSHI, (b) SPM, and (c) QAHI. (d)–(f) Signal amplified by weak measurement technique. The real (solid) and imaginary (dashed) parts of the Hall conductivity are depicted in (g). (h) The original signal and (i) the amplified signal as a function of photon energy. The parameters are Λ/λSO=0 (QSHI), 1 (SPM), and 2 (QAHI). elEz/λSO=0.
    (a) Postselection probability T as a function of time delay τ and the coupling constant of light Λ/λSO. Variation of the spectral shifts with (b) selected angle ϵ, (c) spectral width λ, and (d) time delay. The parameters are Ez=0, and incident angle θi=45 deg.
    Fig. 7. (a) Postselection probability T as a function of time delay τ and the coupling constant of light Λ/λSO. Variation of the spectral shifts with (b) selected angle ϵ, (c) spectral width λ, and (d) time delay. The parameters are Ez=0, and incident angle θi=45  deg.
    Weijie Wu, Shizhen Chen, Wenhao Xu, Zhenxing Liu, Runnan Lou, Lihua Shen, Hailu Luo, Shuangchun Wen, Xiaobo Yin. Weak-value amplification for the optical signature of topological phase transitions[J]. Photonics Research, 2020, 8(12): B47
    Download Citation