
Wen XI, Haibo LI. Preparation of TiO2/Ti3C2Tx Composite for Hybrid Capacitive Deionization [J]. Journal of Inorganic Materials, 2021, 36(3): 283
- Journal of Inorganic Materials
- Vol. 36, Issue 3, 283 (2021)
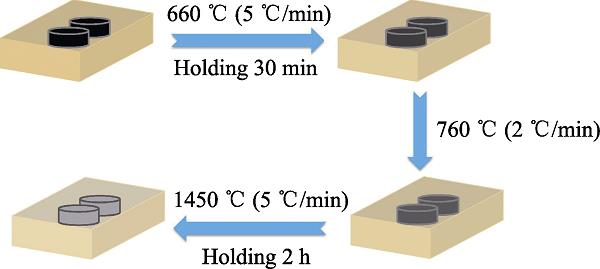
1. Calcination process of Ti3AlC2
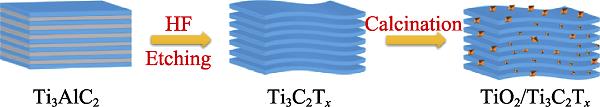
2. Synthesis flowchart of TiO2/Ti3C2Tx composites
3. SEM images of Ti3AlC2(A), Ti3C2Tx (B, C), TiO2/Ti3C2Tx -350(D), TiO2/Ti3C2Tx -450(E) and TiO2/Ti3C2Tx -550(F), HRTEM (G) and elemental mapping(H, I) of TiO2/Ti3C2Tx -450
4. XRD patterns (A) of various samples, XRD patterns (B, C) of TiO2/Ti3C2Tx calcined at different temperatures, Raman spectra (D), N2 adsorption-desorption isotherms (E) and pore size distributions (F) of various samples
5. XPS spectra of Ti3C2Tx , TiO2/Ti3C2Tx -350, TiO2/Ti3C2Tx -450 and TiO2/Ti3C2Tx -550
6. CV curves(A), GCD(B) and EIS(C) of Ti3C2Tx , TiO2/Ti3C2Tx -350, TiO2/Ti3C2Tx -450 and TiO2/Ti3C2Tx -550 with inset in (C) representing the equivalent circuit
7. Desalination performance of TiO2/Ti3C2Tx -450‖AC device
8. SEM (A) and the enlarged (B) images of TiO2/Ti3C2Tx -450 after 20 cycling, XRD patterns(C, D) of TiO2/Ti3C2Tx -450 before and after desalting and regeneration
|
Table 1. Comparison of specific surface areas, pore sizes and pore volumes of Ti3C2Tx , TiO2/Ti3C2Tx -350, TiO2/Ti3C2Tx -450 and TiO2/Ti3C2Tx -550
|
Table 2. Comparison of salt removal capacity among various CDI electrodes

Set citation alerts for the article
Please enter your email address
© Copyright 2018-2021 | Chinese Laser Press. All Rights Reserved 沪ICP备15018463号-20