
Zexin Feng, Dewen Cheng, Yongtian Wang. Iterative freeform lens design for optical field control[J]. Photonics Research, 2021, 9(9): 1775
- Photonics Research
- Vol. 9, Issue 9, 1775 (2021)
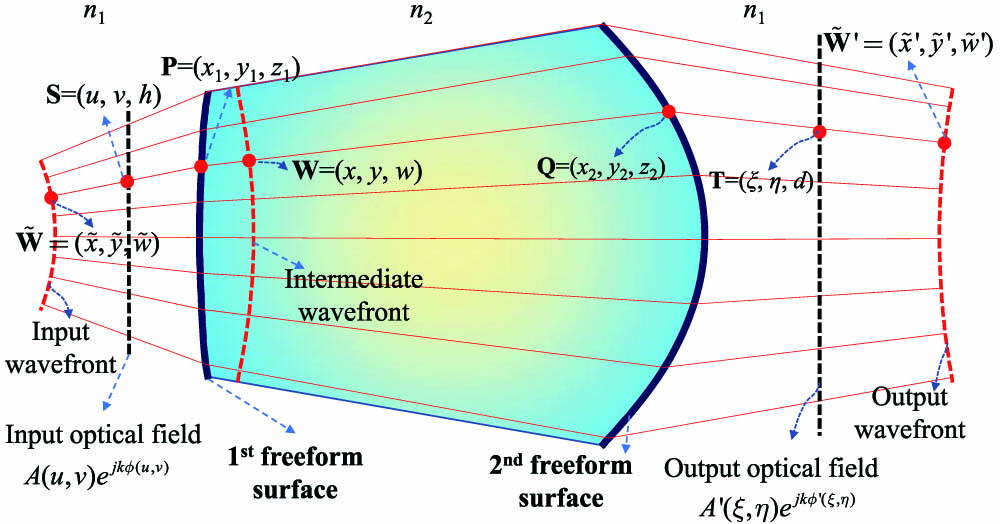
Fig. 1. Sketch of the freeform beam transformer.
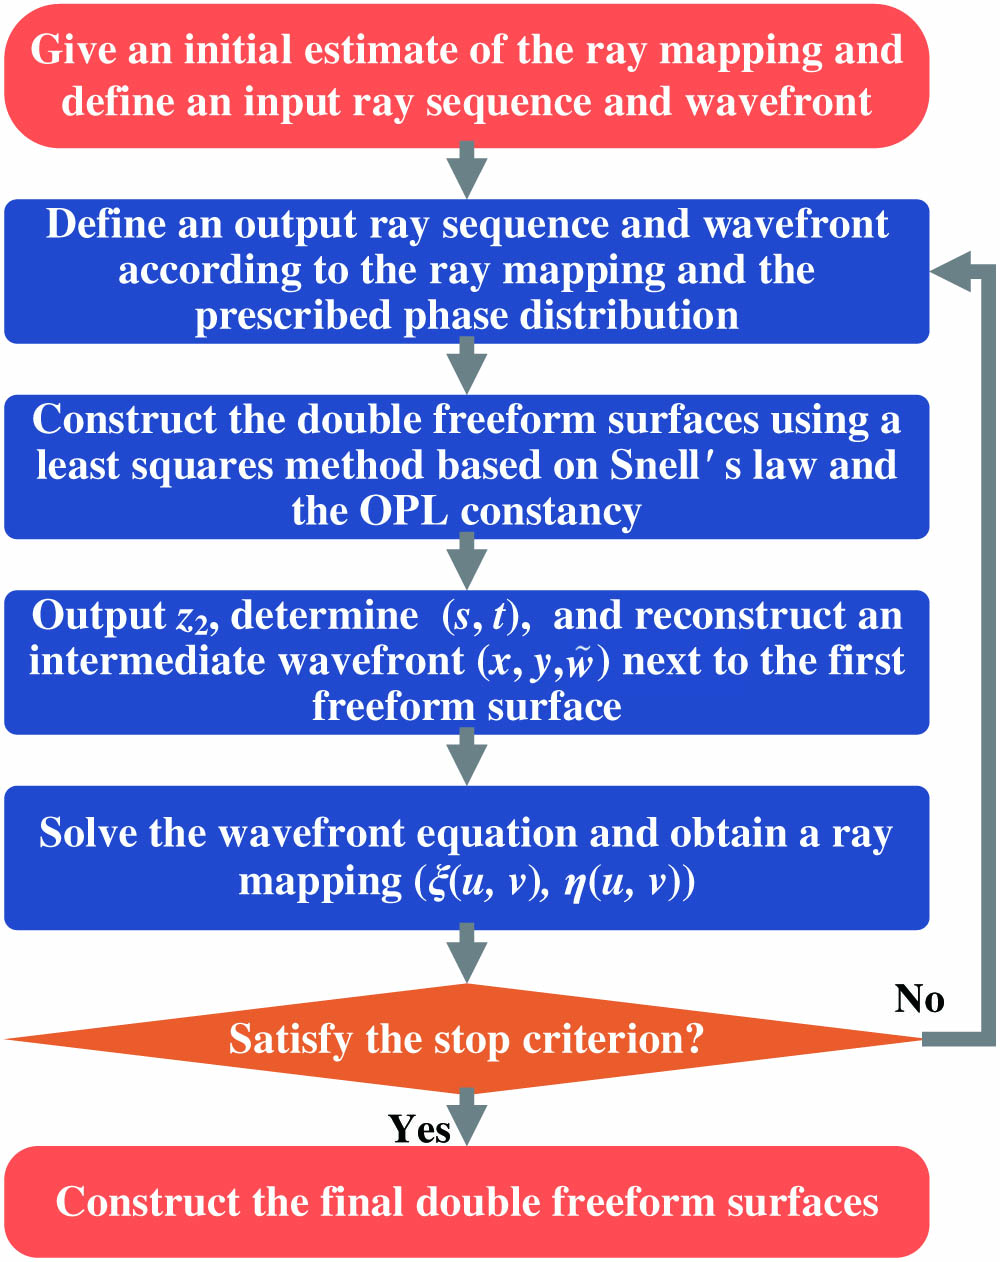
Fig. 2. Diagram of the IWT method for optical field control.
Fig. 3. (a) Irradiance and (b) phase distributions of the input beam on the z = 20 mm z = 45 mm z = 75 mm
Fig. 4. Evolution of the ϵ
Fig. 5. Designed (a) entrance and (b) exit freeform surfaces.
Fig. 6. Simulated results of the freeform lens designed with the new proposed method: (a) ray-tracing illustration in LightTools, and simulated irradiance distributions on the (b) first and (c) second output planes, respectively. Simulated results of the freeform lens designed with the L 2 288 × 288 Γ Γ ′ 256 × 256
Fig. 7. (a) Final ray mapping of the new proposed method; (b) the L 2
Fig. 8. Simulated results of the freeform lens designed with the new proposed method: (a) ray-tracing illustration in LightTools, and simulated irradiance distributions on the (b) first and (c) second output planes, respectively. Simulated results of the freeform lens designed with the L 2

Set citation alerts for the article
Please enter your email address
© Copyright 2018-2021 | Chinese Laser Press. All Rights Reserved 沪ICP备15018463号-20