
Li Xiang, Wang Xiaodan, Ma Hai, Wang Dan, Mao Hongmin, Zeng Xionghui. Research Progress on Adjusting and Controlling Luminescence Performance of GaN∶Eu 3+ Materials[J]. Laser & Optoelectronics Progress, 2020, 57(21): 210004
- Laser & Optoelectronics Progress
- Vol. 57, Issue 21, 210004 (2020)
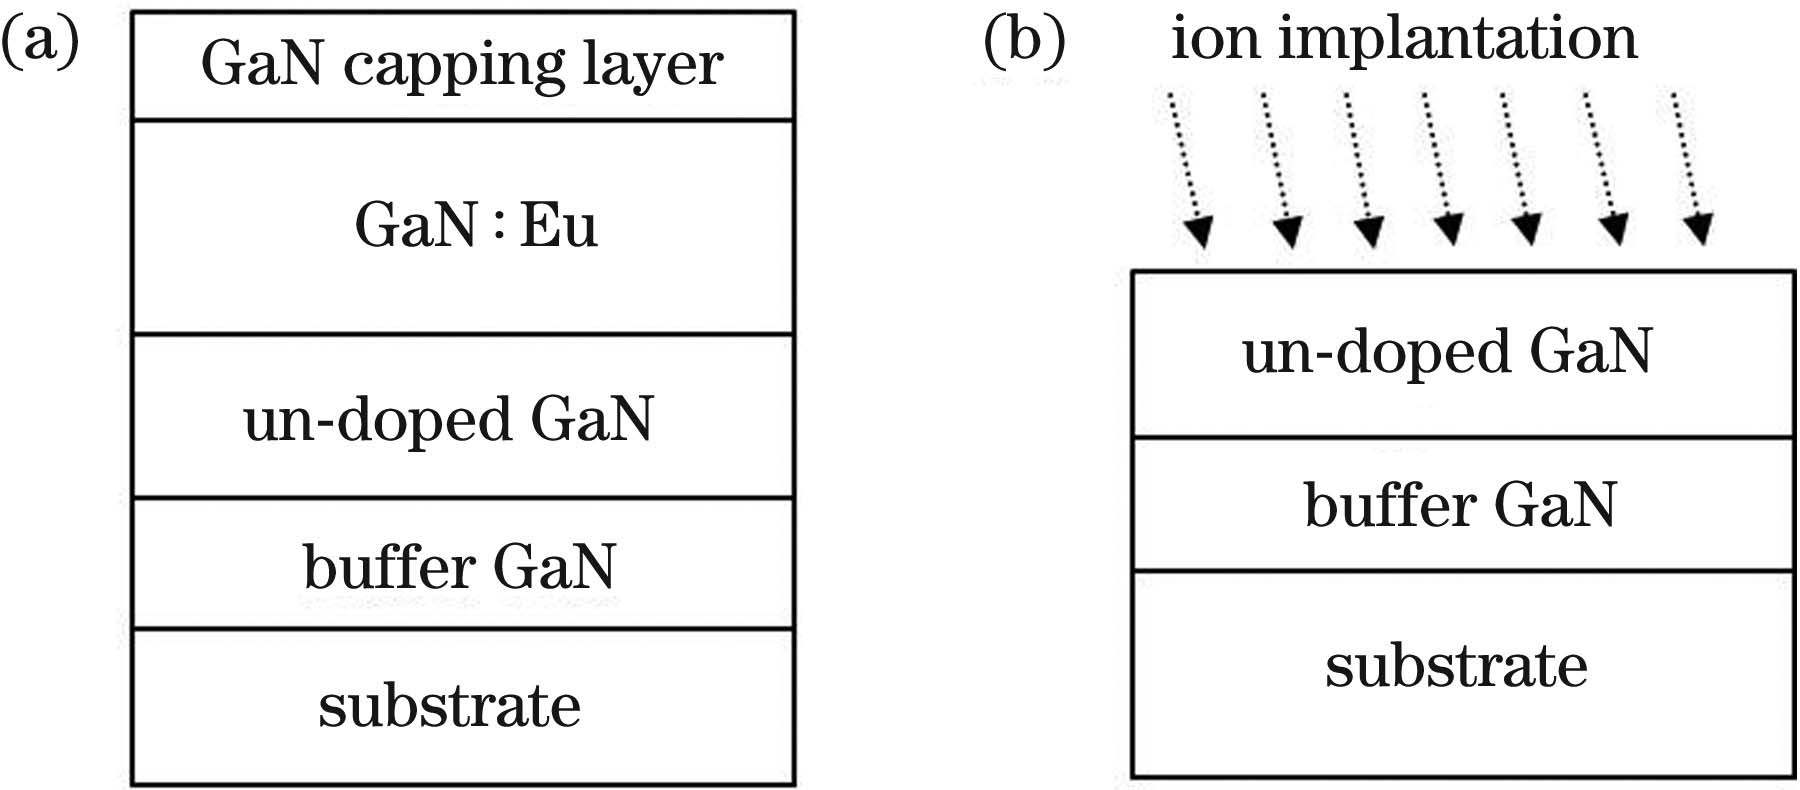
Fig. 1. Structures of GaN∶Eu3+ materials prepared by methods of in-situ growth and ion implantation. (a) In-situ growth; (b) ion implantation
![Room temperature PL spectra of the samples grown at 10 kPa and 100 kPa[15]](/richHtml/lop/2020/57/21/210004/img_2.jpg)
Fig. 2. Room temperature PL spectra of the samples grown at 10 kPa and 100 kPa[15]
Fig. 3. Room temperature CL spectra of GaN∶Eu3+ annealed at 1100, 1200, and 1300 ℃[21]
Fig. 4. EL spectra at different bias voltages[24]. (a) Yellow light emission at bias voltage of -100 V; (b) orange light emission at bias voltage of -70 V
Fig. 5. EL spectra of blue, green, and red light emissions from GaN∶Tm3+, Er3+, Eu3+ samples at bias voltages of -70 V and -100 V[26]
Fig. 6. Energy transfer diagram of GaN∶Eu3+/Er3+ samples[29]
Fig. 7. PL spectra for 5D0→7F2 transition of Eu3+ in GaN∶Eu3+/Mg2+ under above bandgap excitation at RT[31]
Fig. 8. PL spectra at 25 K for GaN∶Eu3+/Mg2+ films with Eu3+ ion concentrations of 3×10¹⁸, 3×10¹⁹, and 3×1020 cm-3 [36]
Fig. 9. PL spectra of samples GaN∶Eu3+ and GaN∶Eu3+/Mg2+ at room temperature with doped ion dose (Eu3+ and Eu3+, Mg2+) of 5×1014 cm-2 [37]
Fig. 10. PL spectra of the p-GaN samples[42]. 1—GaN∶Mg2+, 2—GaN∶Eu3+/Mg2+, and 3—GaN∶Eu3+/Mg2+/Zn2+. PL in the long-wavelength is shown in the inset: 1—GaN∶Eu3+/Mg2+/Zn2+and 2—GaN∶Eu3+/Mg2+

Set citation alerts for the article
Please enter your email address
© Copyright 2018-2021 | Chinese Laser Press. All Rights Reserved 沪ICP备15018463号-20