• Acta Optica Sinica
  • Vol. 38, Issue 11, 1106002 (2018)
Cheng Cheng** and Fangjie Wang*
Author Affiliations
  • Institute of Intelligent Optoelectronic Technology, Zhejiang University of Technology, Hangzhou, Zhejiang 310023, China
  • show less
    DOI: 10.3788/AOS201838.1106002 Cite this Article Set citation alerts
    Cheng Cheng, Fangjie Wang. Experimental Realization of PbSe Quantum-Dot Fiber Amplifier in NIR Broad-Waveband Based on Sodium-Aluminum-Borosilicate Silicate Glass[J]. Acta Optica Sinica, 2018, 38(11): 1106002 Copy Citation Text show less
    Comparison between PbSe-QDF and conventional SiO2 single mode fiber
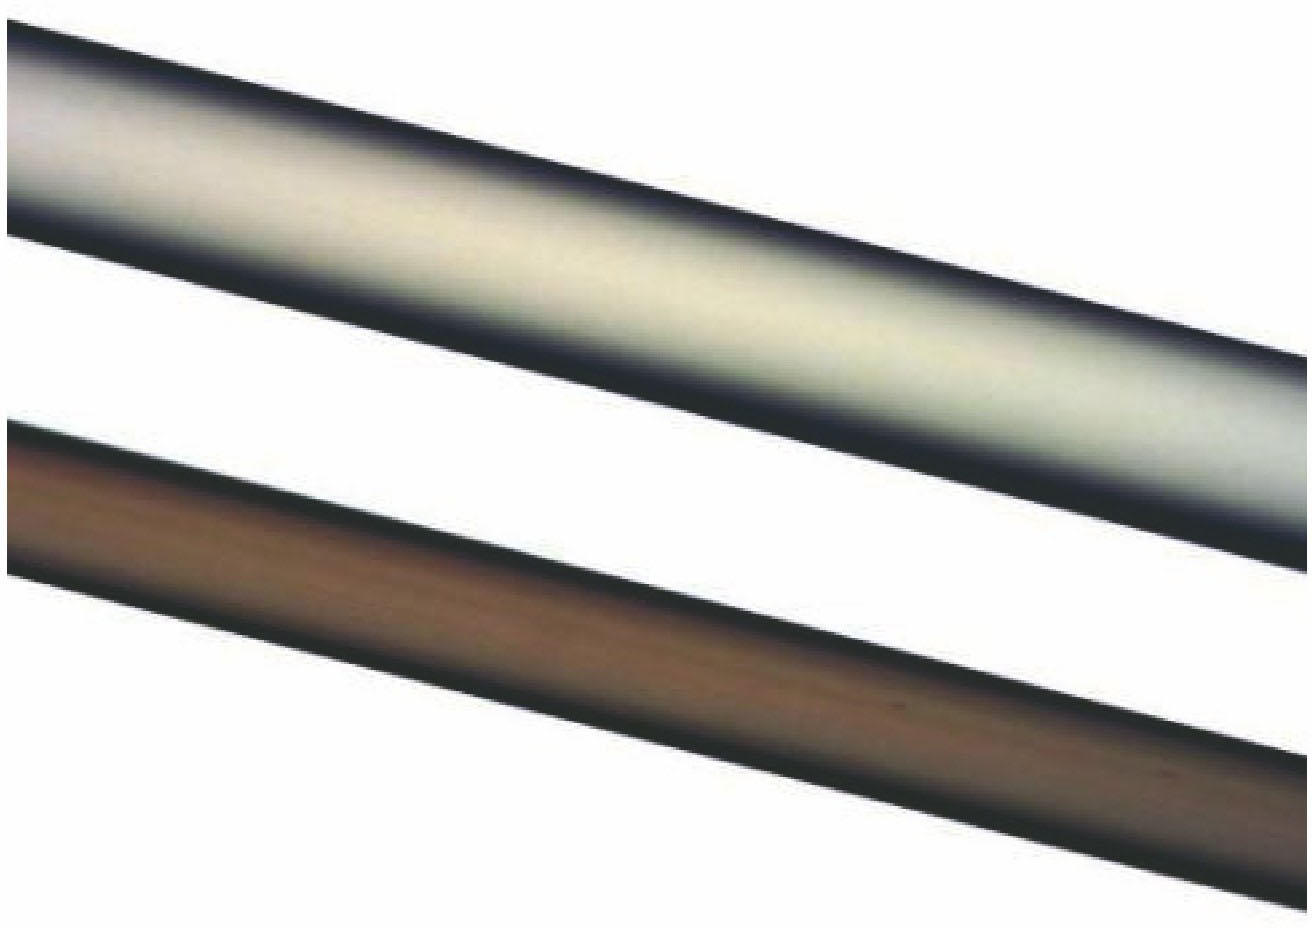
    Fig. 1. Comparison between PbSe-QDF and conventional SiO2 single mode fiber
    TEM images of PbSe quantum dot doped glass fiber under different scales. (a) 20 nm; (b) 5 nm; (c) 2 nm
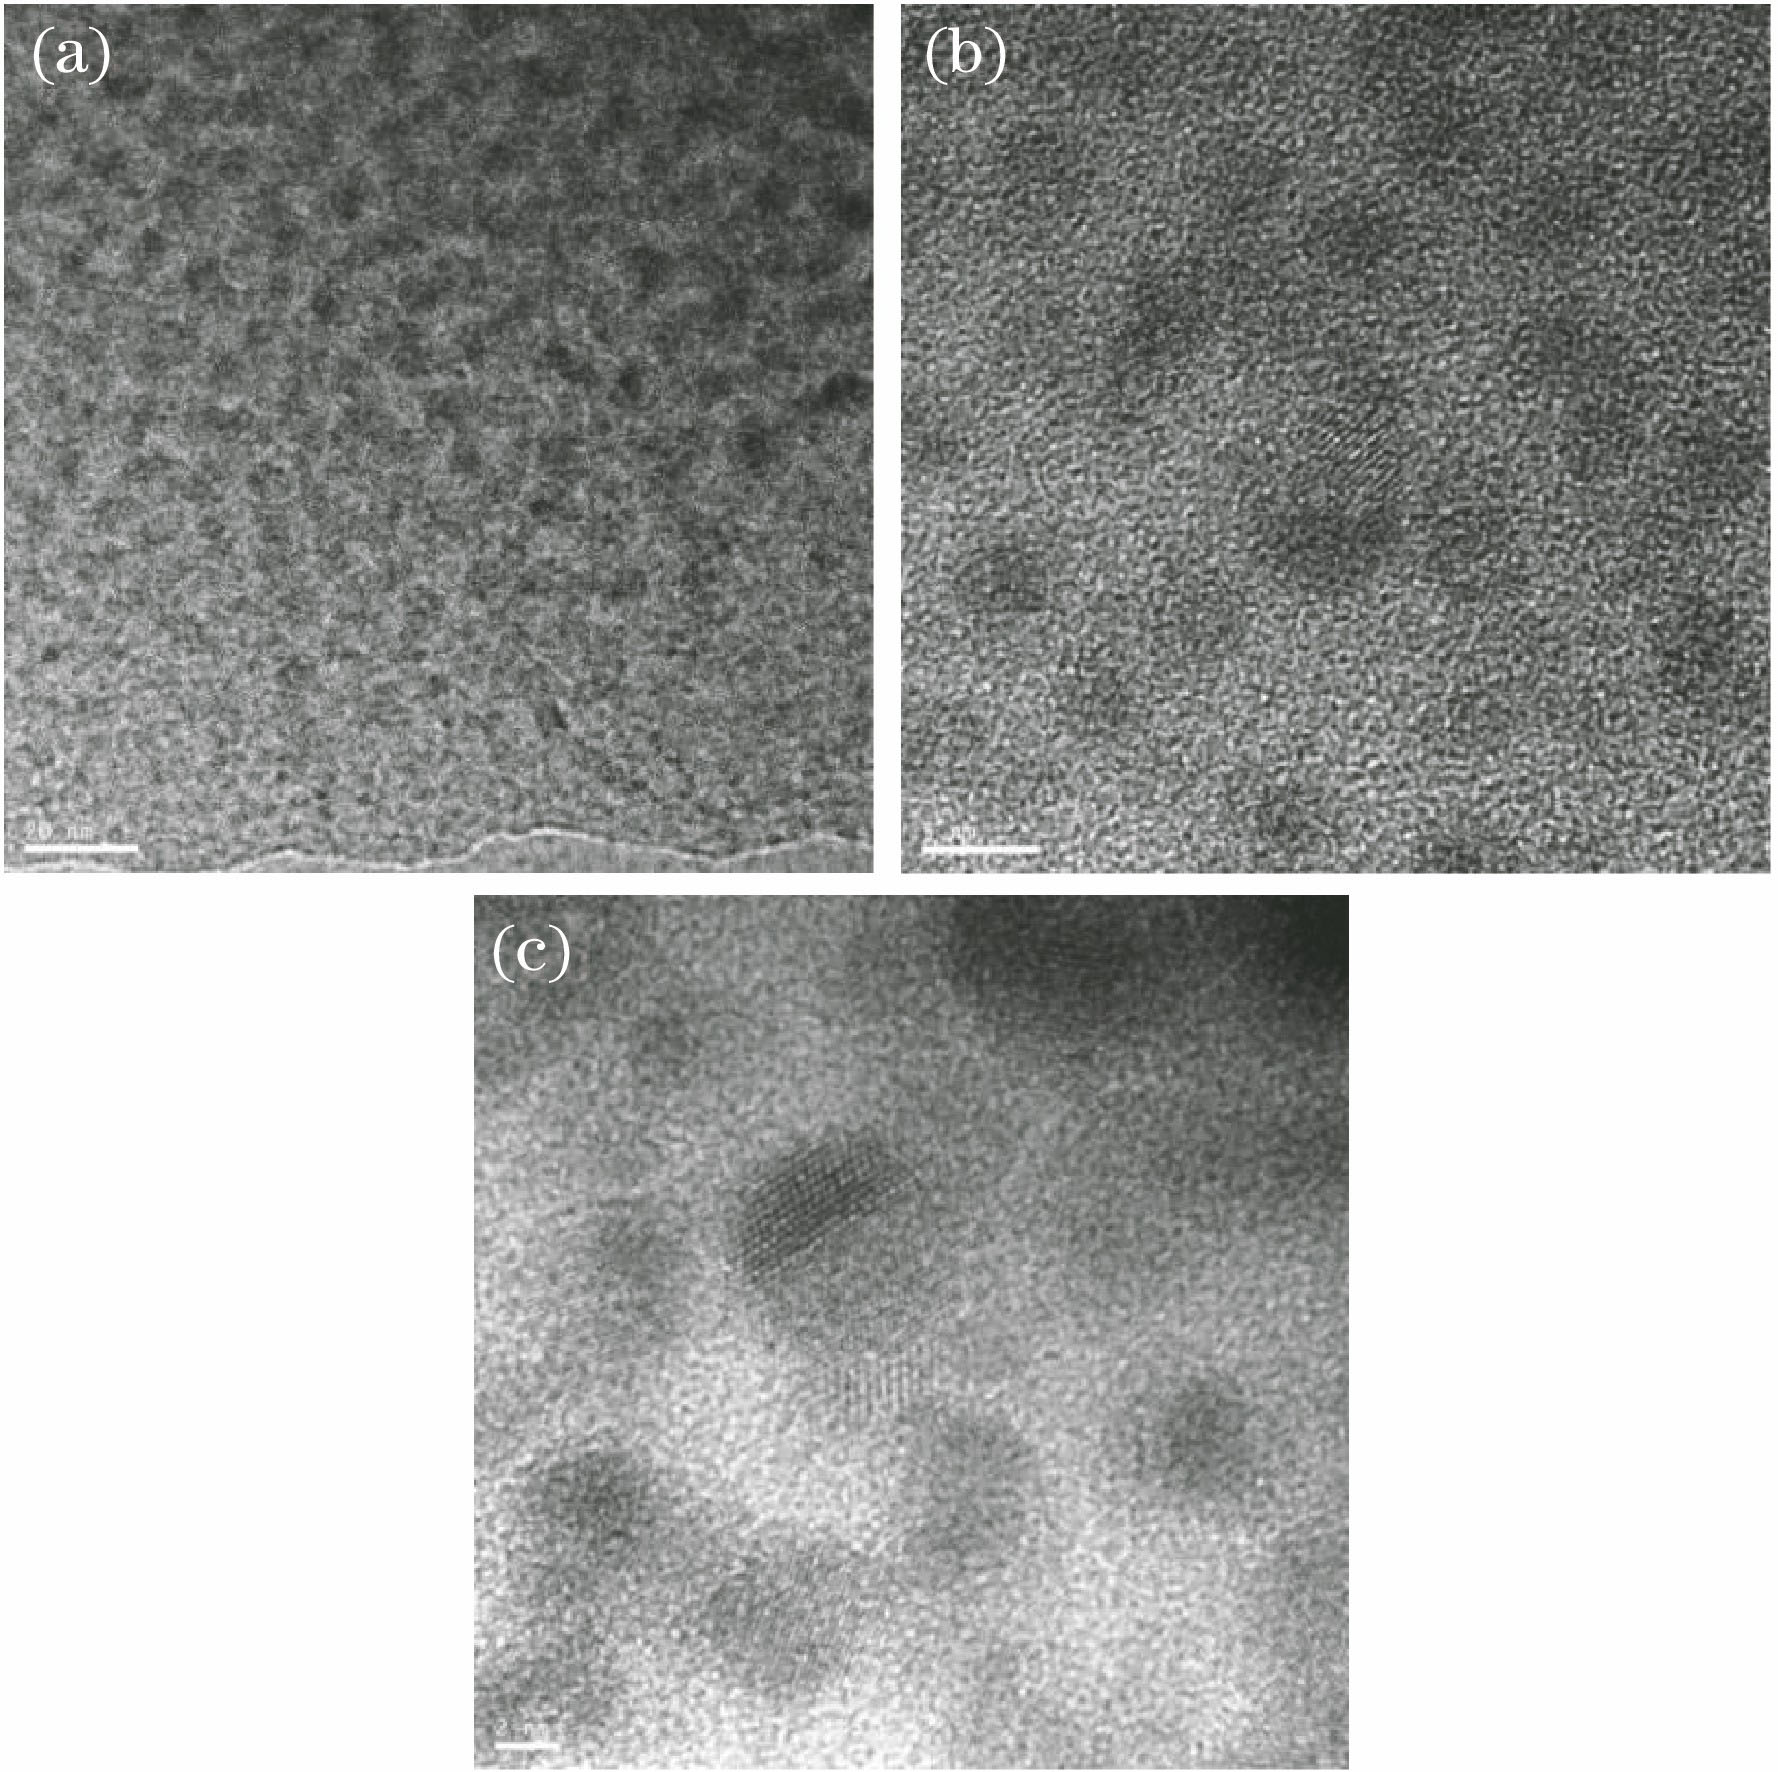
    Fig. 2. TEM images of PbSe quantum dot doped glass fiber under different scales. (a) 20 nm; (b) 5 nm; (c) 2 nm
    Particle-size distribution of PbSe QDs in fiber samples
    Fig. 3. Particle-size distribution of PbSe QDs in fiber samples
    Level-transition diagram of PbSe QDs
    Fig. 4. Level-transition diagram of PbSe QDs
    Absorption-emission spectra of PbSe-QDF
    Fig. 5. Absorption-emission spectra of PbSe-QDF
    Measured pump power versus fiber length
    Fig. 6. Measured pump power versus fiber length
    PL spectra of QDF. (a) PL intensity of QDF versus fiber length under different annealing conditions; (b) PL intensity spectral distribution under different fiber lengths
    Fig. 7. PL spectra of QDF. (a) PL intensity of QDF versus fiber length under different annealing conditions; (b) PL intensity spectral distribution under different fiber lengths
    Comparison of PL spectra of the identical QDF. (a) Initial time; (b) one month later
    Fig. 8. Comparison of PL spectra of the identical QDF. (a) Initial time; (b) one month later
    Experimental setup of QDFA
    Fig. 9. Experimental setup of QDFA
    Spectral distribution of QDFA output signal under different pump powers. The illustration is output spectrum for zero pump
    Fig. 10. Spectral distribution of QDFA output signal under different pump powers. The illustration is output spectrum for zero pump
    Homogeneity of the output signal gain of QDFA
    Fig. 11. Homogeneity of the output signal gain of QDFA
    Variation curves of switching gain of QDFA under different pump powers
    Fig. 12. Variation curves of switching gain of QDFA under different pump powers
    Signal gain versus pump power, where the illustration is partial magnification. (a) QDFA in this paper (switching gain for Pi≈-17 dBm); (b) QDFAevan(Pi≈-63 dBm)[10] and FMEDFA (Pi≈-10 dBm)[13]
    Fig. 13. Signal gain versus pump power, where the illustration is partial magnification. (a) QDFA in this paper (switching gain for Pi≈-17 dBm); (b) QDFAevan(Pi≈-63 dBm)[10] and FMEDFA (Pi≈-10 dBm)[13]
    Gain and noise spectra of QDFA
    Fig. 14. Gain and noise spectra of QDFA
    Curves of noise figure versus pump power
    Fig. 15. Curves of noise figure versus pump power
    Curves of signal gain (net gain) versus signal power
    Fig. 16. Curves of signal gain (net gain) versus signal power
    SampleHeat treatment temperature /℃Heat treatment time /hCentral diameter of QDs /nmPL-peak wavelength /nm
    G15307.54.081180±40
    G25407.54.361234±40
    G35507.54.761310±40
    G45607.55.171450±40
    G56007.55.721550±40
    G65507.54.761310±40
    G7550155.611540±40
    G8550305.881600±40
    Table 1. Diameter of PbSe QDs and photoluminescence (PL)-peak wavelength versus annealing temperature and time
    ParameterWorking waveband /nmBandwidth /nmNf /dBPth /mWPp /mW (saturated pump power)
    EDFAs(conventional single fiber)[4]C(1535-1560)~253.8-4.2~1~100
    EDFA(double-pass)[15]C(1528-1568)~40~7.5-~120
    FMEDFA[13]C(1535-1560)25(1535-1560)>6->338.8
    QDFAevan101440-1640~80-~35~195
    QDFA(this paper)S(1260-1380)80(1284-1364)2.89-3.041.4~73.6
    Table 2. Comparison of performance among the QDFA in this paper and EDFAs, EDFA, FMEDFAs, QDFAevan
    Cheng Cheng, Fangjie Wang. Experimental Realization of PbSe Quantum-Dot Fiber Amplifier in NIR Broad-Waveband Based on Sodium-Aluminum-Borosilicate Silicate Glass[J]. Acta Optica Sinica, 2018, 38(11): 1106002
    Download Citation